
In - Market Field Manifold-MFM
อินดิเคเตอร์
เวอร์ชัน 1.0, Feb 2026
Windows, Mac
4.5
รีวิว: 4
ตั้งแต่ 03/01/2026
2
การขาย
คำอธิบาย
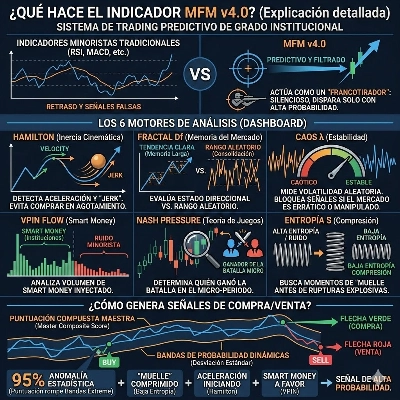
ตัวบ่งชี้ MFM v4.0 ทำอะไรได้บ้าง?
Market Field Manifold (MFM) v4.0 เป็นระบบการซื้อขายเชิงทำนายระดับสถาบัน แตกต่างจากตัวบ่งชี้ค้าปลีกแบบดั้งเดิม (เช่น RSI หรือ MACD) ที่ล่าช้าโดยการเฉลี่ยข้อมูลในอดีต MFM ใช้ฟิสิกส์ ทอพอโลยี และทฤษฎีข้อมูลเพื่อ ทำนายความผิดปกติที่กำลังจะเกิดขึ้น และกรองสัญญาณหลอกลวงอย่างเข้มงวด
มันทำหน้าที่เหมือน "นักสไนเปอร์": เงียบเกือบตลอดเวลาและจะแสดงลูกศรเมื่อคณิตศาสตร์ยืนยันว่าการเคลื่อนไหวของราคาที่มีโอกาสสูงเพิ่งเริ่มต้นขึ้น
🧠 เครื่องยนต์วิเคราะห์ 6 ตัว (สิ่งที่คุณอ่านบนแดชบอร์ด)
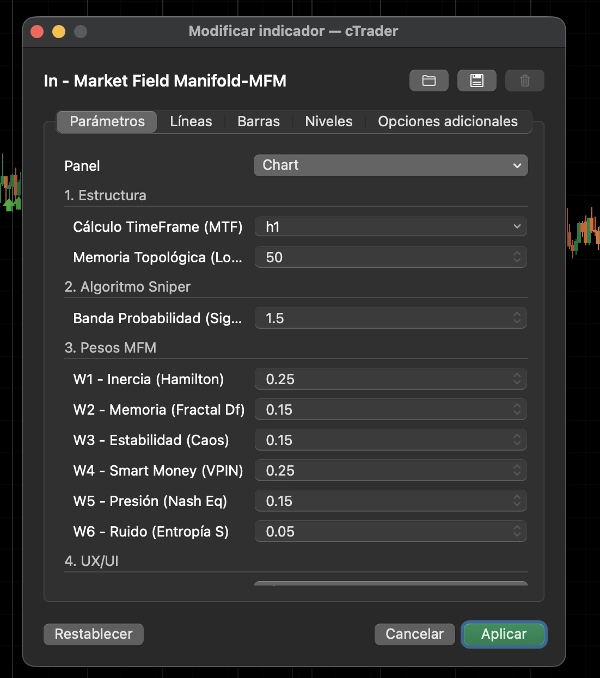
- Hamilton (ความเฉื่อยเชิงจลน์): วัดความเร่งและ "Jerk" ของราคา ตรวจจับว่าการเคลื่อนไหวเพิ่งเริ่มต้นด้วยโมเมนตัมสูง ป้องกันไม่ให้คุณซื้อที่จุดสูงสุดเมื่อการเคลื่อนไหวหมดแรงแล้ว
- Fractal Df (ความทรงจำของตลาด): ประเมินว่าตลาดอยู่ในสถานะทิศทางที่ชัดเจน (ความทรงจำระยะยาว) หรือแค่เด้งแบบสุ่มในช่วงที่ผันผวน (การรวมตัว)
- Chaos λ (ความเสถียร): วัดระดับความผันผวนแบบสุ่ม หากตลาดมีความวุ่นวายหรือถูกควบคุมมากเกินไป MFM จะทำเครื่องหมายว่า "วุ่นวาย" และบล็อกสัญญาณการซื้อขายทั้งหมด
- VPIN Flow (เงินอัจฉริยะ): วิเคราะห์ปริมาณ tick ที่ข้ามกับช่วงราคาสำหรับตรวจสอบว่า Smart Money (สถาบัน) กำลังฉีดเงินทุนจริงหรือเป็นเพียงเสียงรบกวนจากค้าปลีก
- Nash Pressure (ทฤษฎีเกม): ดูว่าราคาปิดของแท่งเทียนอยู่ที่ใดเมื่อเทียบกับสูงสุดและต่ำสุดเพื่อกำหนดว่าใครเป็นฝ่ายชนะอย่างชัดเจน (ผู้ซื้อหรือผู้ขาย) ในช่วงเวลานั้น
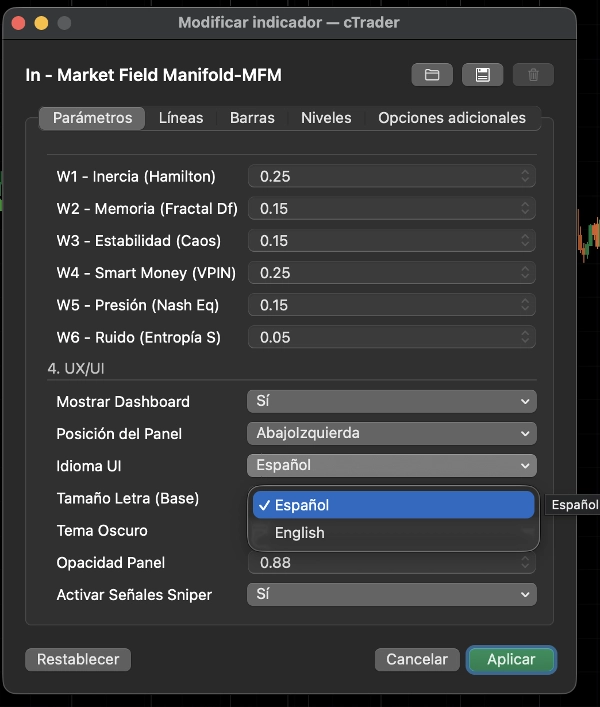
- Entropy S (การบีบอัด): วัดความไม่เป็นระเบียบของตลาด โดยเฉพาะอย่างยิ่งค้นหา "สปริงบีบอัด" (เอนโทรปีต่ำ/เสียงรบกวนต่ำ) เพราะการเบรกเอาต์ที่รุนแรงและมีกำไรมากที่สุดมักเกิดจากการรวมตัวที่เงียบสงบ
🎯 มันสร้างสัญญาณซื้อ/ขายอย่างไร?
ตัวบ่งชี้คำนวณคะแนนรวมหลัก แทนที่จะใช้เกณฑ์คงที่เพื่อให้คุณเข้าซื้อ MFM สร้าง แถบความน่าจะเป็นแบบไดนามิก (มันคำนวณส่วนเบี่ยงเบนมาตรฐานเคลื่อนที่ของตัวเอง)
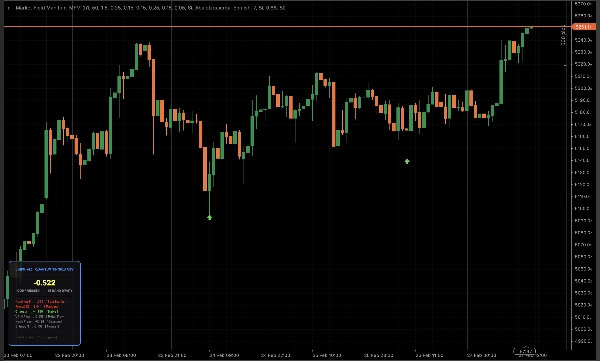
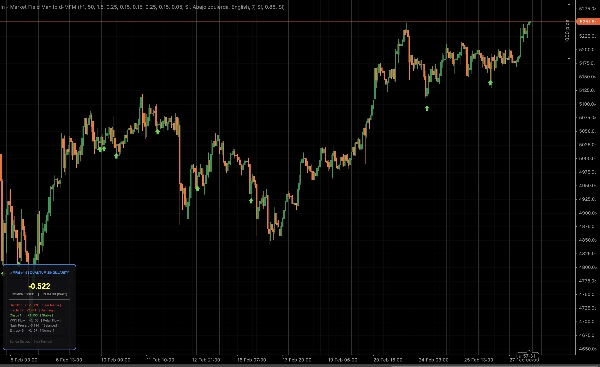
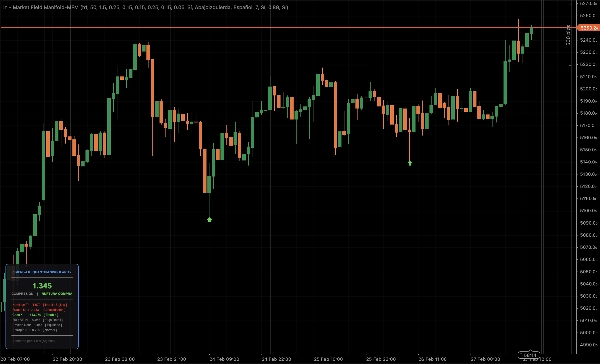
- คุณจะเห็นเพียง ลูกศรสีเขียว (ซื้อ) หรือ ลูกศรสีแดง (ขาย) เมื่อคะแนนทะลุแถบสุดขีดเหล่านี้ (ความผิดปกติทางสถิติ 95%) "สปริง" ถูกบีบอัด ความเร่งเพิ่งเริ่มต้น และเงินอัจฉริยะอยู่ในฝ่ายคุณ
สรุป
AI summary
The Market Field Manifold (MFM) v4.0 is an institutional-grade predictive trading indicator designed to forecast imminent market anomalies and filter out false breakouts. Unlike traditional lagging indicators, it applies principles from physics, topology, and information theory to identify high-probability explosive price moves. The indicator remains mostly silent, signaling only when a statistically significant move begins, marked by green (buy) or red (sell) arrows.
MFM v4.0 integrates six analytical engines displayed on its dashboard:
1. Hamilton (Kinematic Inertia): Detects acceleration and momentum onset to avoid late entries.
2. Fractal Df (Market Memory): Assesses market directionality versus consolidation.
3. Chaos λ (Stability): Measures market volatility and flags chaotic conditions to suppress signals.
4. VPIN Flow (Smart Money): Identifies institutional capital flow versus retail noise.
5. Nash Pressure (Game Theory): Determines buyer or seller dominance within micro-periods.
6. Entropy S (Compression): Detects low-noise consolidation phases that precede breakouts.
Buy and sell signals are generated when a composite score breaks dynamic probability bands, indicating a 95% statistical anomaly with favorable conditions including compressed price action, accelerating momentum, and smart money involvement. The indicator supports multiple markets including Forex, cryptocurrencies, stocks, indices, and commodities.
MFM v4.0 integrates six analytical engines displayed on its dashboard:
1. Hamilton (Kinematic Inertia): Detects acceleration and momentum onset to avoid late entries.
2. Fractal Df (Market Memory): Assesses market directionality versus consolidation.
3. Chaos λ (Stability): Measures market volatility and flags chaotic conditions to suppress signals.
4. VPIN Flow (Smart Money): Identifies institutional capital flow versus retail noise.
5. Nash Pressure (Game Theory): Determines buyer or seller dominance within micro-periods.
6. Entropy S (Compression): Detects low-noise consolidation phases that precede breakouts.
Buy and sell signals are generated when a composite score breaks dynamic probability bands, indicating a 95% statistical anomaly with favorable conditions including compressed price action, accelerating momentum, and smart money involvement. The indicator supports multiple markets including Forex, cryptocurrencies, stocks, indices, and commodities.
โปรไฟล์อินดิเคเตอร์
รีวิวจากลูกค้า
4.5
รีวิว: 4
5 | 50 % | |
4 | 50 % | |
3 | 0 % | |
2 | 0 % | |
1 | 0 % |
รีวิวจากลูกค้า
March 11, 2026
on a cautious test, Starting small. 2 timeframes feels enough, and 3 percent DD would be my limit before changing settings. The weak spot shows up when risk stops matching the setup.
March 5, 2026
not some auto win thing, but it has a clear role. It helps with AI assisted trading, while the weak spot is that AI output still needs a manual filter. Better rechecked it on 30 days.
March 2, 2026
The first run should stay simple. For AI assisted trading, 114 setups on daily close is enough to see whether the tool deserves more attention.
March 1, 2026
Is easier to judge after expectations are normal. It can help with AI assisted trading, but the trader still needs to know why the entry makes sense. The useful comparison is hit rate versus average R.
การสนทนา
คำถามที่พบบ่อย
BTCUSD
Forex
Signal
Indices
EURUSD
Commodities
GBPUSD
NZDUSD
Prop
Scalping
Crypto
Stocks
XAUUSD
NAS100
USDJPY
ผลิตภัณฑ์ที่มีให้บริการผ่าน cTrader Store รวมถึงบอทการเทรด อินดิเคเตอร์ และปลั๊กอิน มีให้บริการโดยนักพัฒนาบุคคลที่สามและมีไว้เพื่อวัตถุประสงค์ในการเข้าถึงข้อมูลและทางเทคนิคเท่านั้น cTrader Store ไม่ใช่โบรกเกอร์และไม่ได้ให้คำแนะนำการลงทุน คำแนะนำส่วนบุคคล หรือการรับประกันผลการดำเนินงานในอนาคต
เพิ่มเติมจากผู้เขียนคนนี้













ราคา
ตั้งแต่ 03/01/2026
2
การขาย