Beschreibung
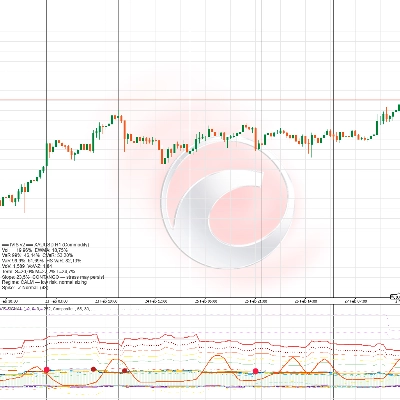
Die meisten Trader verlassen sich auf nachlaufende Indikatoren, die erst nach der Kursbewegung reagieren. Die FFT-SDE Visual Engine verfolgt einen grundlegend anderen, quantitativen Ansatz. Sie ist nicht nur ein Oszillator; es handelt sich um eine Echtzeit-Signalverarbeitungs- und Prognosesuite, die direkt in cTrader integriert ist.
Sie basiert auf zwei Kernprinzipien:
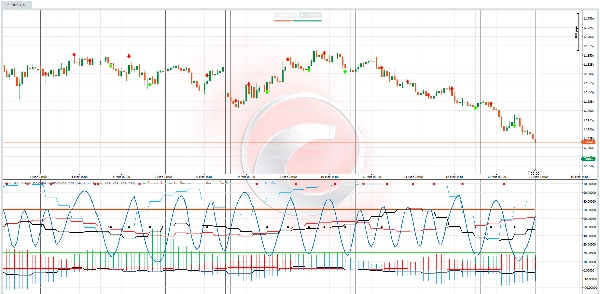
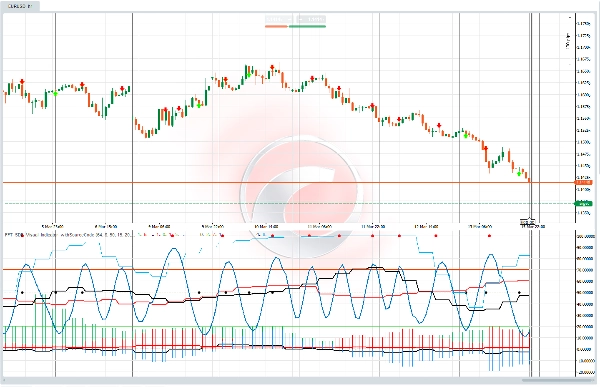
- Der Markt hat Rhythmen (Zyklen): Mithilfe der Fast Fourier Transform (FFT) Analyse zerlegt der Indikator die Kursbewegung in ihre Kernfrequenzkomponenten, filtert Rauschen heraus und zeigt den dominanten, handelbaren Zyklus an. Dies sagt Ihnen wann der Markt wahrscheinlich drehen wird.
- Die Kursbewegung hat eine statistische Natur (SDE): Durch die Modellierung des Kurses als stochastische Differentialgleichung (Ornstein-Uhlenbeck-Prozess) quantifiziert der Indikator die Drift (Momentum), Volatilität (Risiko) und die Geschwindigkeit der Mittelwertrückkehr des Marktes. Dies sagt Ihnen wie sich der Markt wahrscheinlich bewegen wird und die Wahrscheinlichkeit für einen erfolgreichen Trade.
Durch die Verschmelzung dieser beiden Welten—Zyklus-Analyse (FFT) und Stochastische Prognose (SDE)—bietet die FFT-SDE Engine eine ganzheitliche Sicht auf den Markt, die in Standardwerkzeugen schlichtweg nicht verfügbar ist.
2. Kernnutzen: Welche Probleme löst sie?
So kann ein Trader diesen Indikator nutzen, um seine Entscheidungsfindung zu verbessern:
- Problem 1: „Ich kann nicht erkennen, ob der Markt trendet oder sich nur seitwärts bewegt.“
-
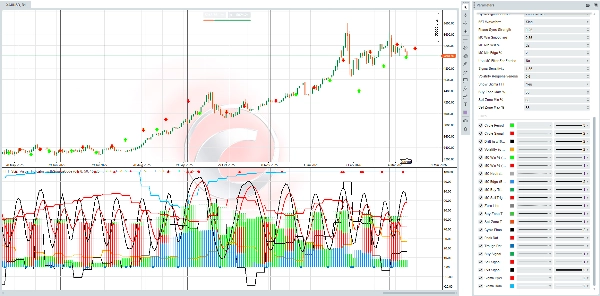
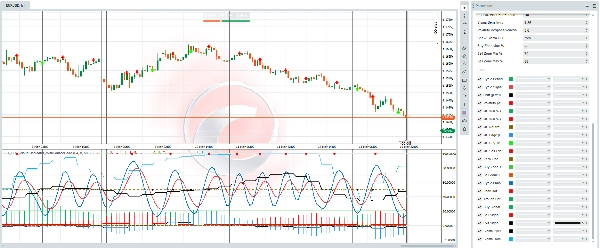
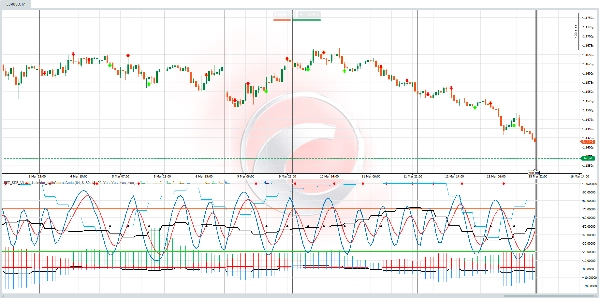
- Lösung (Zyklusdauer & Sigma-Zyklizität): Das Zyklusdauer Histogramm zeigt sofort die Länge des aktuell dominanten Marktzyklus an. Wenn der Zyklus klar und stark ist, können Sie die Schwankungen handeln. Wenn die Sigma-Zyklizität % (Volatilitätszyklus) hoch ist, wissen Sie, dass Perioden der Ausdehnung und Kontraktion des Risikos zu erwarten sind, was Ihnen erlaubt, Ihre Positionsgröße dynamisch anzupassen.
- Problem 2: „Meine Einstiege sind immer zu früh oder zu spät.“
-
- Lösung (Zyklusphase & Einstiegszonen): Der Indikator bildet den Marktzyklus als eine glatte 0-100% Welle ab—die Zyklusphase % . Anstatt Tops und Bottoms zu erraten, können Sie warten, bis der Kurs vordefinierte Kauf- (0-35%) und Verkaufszonen (60-88%) betritt. Diese sind keine willkürlichen Levels; sie werden dynamisch aus der dominanten Frequenz des Marktes abgeleitet und verschaffen Ihnen einen erheblichen Timing-Vorteil.
- Problem 3: „Ich weiß nicht, ob ein Setup eine hohe Erfolgswahrscheinlichkeit hat.“
-
- Lösung (Monte-Carlo-Simulation): Dies ist das Killer-Feature. Für jeden Balken führt die Engine hunderte simulierte Kursverläufe (Monte Carlo) basierend auf der aktuellen Marktdynamik durch. Anschließend gibt sie die MC Gewinn % (Kauf) und MC Gewinn % (Verkauf) aus. Dies ist kein Gefühl oder eine Vermutung; es ist eine statistische Wahrscheinlichkeit, dass ein 1:2,5 Risiko-Ertrags-Trade erfolgreich ist bevor Sie ihn überhaupt eingehen. Sie können buchstäblich sehen, ob die Chancen zu Ihren Gunsten stehen.
- Problem 4: „Standardindikatoren sind zu langsam und zu verrauscht.“
-
- Lösung (Adaptiv & Vielseitig): Dieser Indikator ist nicht statisch. Sein Adaptives Volatilitätsmodell reagiert in Echtzeit auf Kurs-Schocks und Zyklusimpulse. Das Sigma FFT zeigt Ihnen, ob die Volatilität selbst zyklisch wird und warnt vor bevorstehenden ruhigen oder explosiven Phasen. Jede Komponente ist darauf ausgelegt, sich an die aktuellen Marktbedingungen anzupassen.
Sie werden keinen anderen Indikator im cTrader-Marktplatz finden, der diese Funktionen in einem einzigen, kohärenten und visuellen System kombiniert.
- Die „Sigma FFT“-Ebene: Es ist eine Sache zu wissen, dass der Kurs einen Zyklus hat. Es ist eine ganz neue Ebene der Raffinesse zu wissen, dass die Volatilität selbst einen Zyklus hat. Dies verschafft einen enormen Vorteil bei der Antizipation von Marktstrukturveränderungen.
- Wahrscheinlichkeitsvorteil, keine Gewissheit: Die Monte-Carlo-Ergebnisse bewegen den Trader weg von der Suche nach dem „heiligen Gral“ der Gewissheit hin zu einer professionellen Denkweise, die Wahrscheinlichkeiten und Vorteile managt.
- Vollständig visuell & anpassbar: All diese komplexe Mathematik wird in einem sauberen, mehrteiligen Format mit umfangreichen Anpassungsmöglichkeiten (27+ Parameter) präsentiert. Sie können es an Ihren spezifischen Handelsstil anpassen, vom Scalping bis zum Swing-Trading.
- Kohärente Verschmelzung: Die Zyklusphase, die Ihre Kauf-/Verkaufssignale erzeugt, ist derselbe Zyklus, der zur Berechnung der Drift und der adaptiven Volatilität verwendet wird. Jeder Teil des Indikators steht im Einklang mit den anderen und schafft ein einheitliches und konsistentes Marktmodell.
Dieser Indikator ist perfekt für den Trader, der:
- Müde von nachlaufenden Indikatoren ist und einen vorausschauenderen, wissenschaftlichen Ansatz sucht.
- Ein gewisses Verständnis von Zyklen, Volatilität und dem Wert statistischer Wahrscheinlichkeiten hat.
- Ein robustes, regelbasiertes Handelssystem aufbauen möchte.
- Instrumente mit zyklischem Verhalten handelt (z. B. Forex-Paare, Indizes, Rohstoffe wie Gold).
- Bereit ist, in ein professionelles Werkzeug zu investieren, um sich einen echten Vorteil auf den Märkten zu verschaffen.
Die FFT-SDE Visual Engine verwandelt komplexe quantitative Finanzkonzepte in ein praktisches, umsetzbares Trading-Tool. Sie führt Sie vom Raten zum Wissen, vom Reagieren zum Antizipieren. Wenn Sie bereit sind, mit einem tieferen Verständnis der Marktstruktur und einem quantifizierbaren Wahrscheinlichkeitsvorteil zu handeln, ist dies die Engine, auf die Sie gewartet haben.
Zusammenfassung
Kundenbewertungen
5 | 67 % | |
4 | 33 % | |
3 | 0 % | |
2 | 0 % | |
1 | 0 % |