
Zero Lag Exponential Moving Average
อินดิเคเตอร์
259 ดาวน์โหลด
เวอร์ชัน 1.0, Aug 2025
Windows, Mac
คำอธิบาย
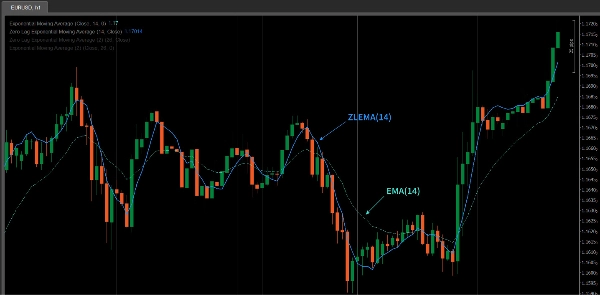
ZLEMA (ค่าเฉลี่ยเคลื่อนที่แบบเอ็กซ์โพเนนเชียลแบบไม่มีดีเลย์) เป็นเวอร์ชันขั้นสูงของค่าเฉลี่ยเคลื่อนที่แบบเอ็กซ์โพเนนเชียล (EMA) ที่ออกแบบมาเพื่อลดดีเลย์ที่มักเกิดขึ้นกับ EMA แบบดั้งเดิม โดยใช้วิธีการคำนวณเฉพาะ ZLEMA จะตอบสนองต่อการเปลี่ยนแปลงของราคาได้รวดเร็วขึ้น ทำให้มีประสิทธิภาพเป็นพิเศษในตลาดที่มีความผันผวนสูง
คุณสมบัติสำคัญของ ZLEMA คือคุณลักษณะ "ไม่มีดีเลย์" ซึ่งช่วยให้มันติดตามการเคลื่อนไหวของราคาได้ใกล้ชิดมากขึ้น โดยเฉพาะในสภาวะตลาดที่เคลื่อนไหวอย่างรวดเร็ว เมื่อเทียบกับ EMA แบบดั้งเดิม ZLEMA มีเวลาตอบสนองที่เร็วกว่า ทำให้จับแนวโน้มตลาดได้ทันท่วงทีมากขึ้น
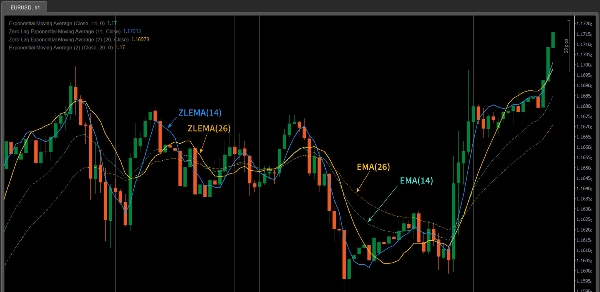
ZLEMA กับ EMA
- ความเร็วในการตอบสนอง: ZLEMA ตอบสนองได้เร็วกว่า EMA แบบดั้งเดิม โดยการชดเชยดีเลย์ ทำให้ติดตามการเปลี่ยนแปลงของราคาได้ทันทีมากขึ้น
- ผลของการทำให้เรียบ: ZLEMA รักษาผลของการทำให้เรียบที่คล้ายกับ EMA ในขณะที่ลดดีเลย์ของราคาให้น้อยลง ทำให้เหมาะสมกับตลาดที่เคลื่อนไหวอย่างรวดเร็วมากขึ้น
- กรณีการใช้งาน: หากคุณเทรดในตลาดที่มีความผันผวนสูง (เช่น การเทรดระยะสั้นหรือภายในวัน) ZLEMA สามารถทำงานได้ดีกว่า EMA ในแง่ของความรวดเร็วในการตอบสนอง
คุณสมบัติของตัวบ่งชี้ ZLEMA
- การตอบสนองแบบไม่มีดีเลย์: ZLEMA ลดดีเลย์ ทำให้สามารถตอบสนองต่อความผันผวนของราคาตลาดได้อย่างรวดเร็ว ทำให้แม่นยำมากขึ้นในการจับการเปลี่ยนแปลงของตลาดอย่างรวดเร็ว
- ความเรียบเนียน: แม้ว่าจะตอบสนองได้เร็วขึ้น ZLEMA ยังคงรักษาผลของการทำให้เรียบของ EMA ช่วยหลีกเลี่ยงเสียงรบกวนที่เกิดจากความผันผวนของราคา
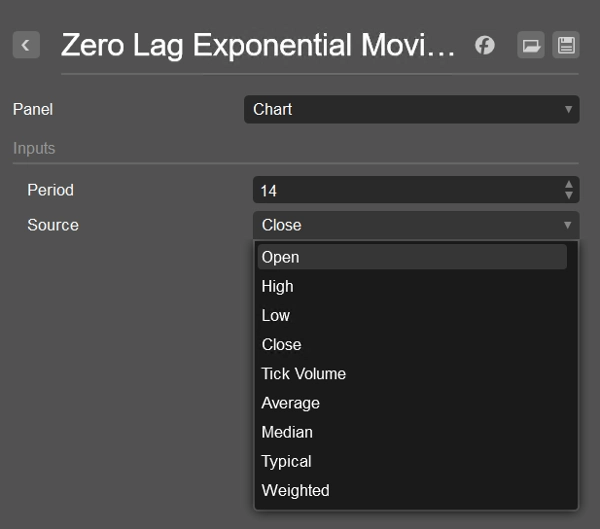
- ความยืดหยุ่น: ZLEMA สามารถใช้กับแหล่งข้อมูลราคาต่าง ๆ (เช่น
Close,Open,Highเป็นต้น) ช่วยให้เทรดเดอร์ปรับแต่งตามความต้องการของกลยุทธ์ได้ - การติดตามแนวโน้มและการยืนยันสัญญาณกลับตัว: ZLEMA เหมาะสำหรับการระบุการเปลี่ยนแปลงแนวโน้ม โดยเฉพาะในตลาดที่มีความผันผวนสูง และยืนยันสัญญาณการกลับตัวของราคา
วิธีใช้ตัวบ่งชี้ ZLEMA
- เทรดเดอร์ระยะสั้น: ZLEMA เหมาะสำหรับเทรดเดอร์ระยะสั้นเนื่องจากสามารถตอบสนองต่อความผันผวนของราคาได้อย่างรวดเร็ว การตอบสนองที่รวดเร็วนี้ทำให้เหมาะสำหรับจับสัญญาณการกลับตัวของแนวโน้มหรือการเบรคเอาต์ในระยะสั้น
- การติดตามแนวโน้ม: ZLEMA ยังสามารถใช้เพื่อติดตามแนวโน้มระยะยาวได้ แต่มีความไวมากกว่า EMA ในแนวโน้มที่แข็งแกร่ง ZLEMA ช่วยระบุจุดเริ่มต้นหรือสิ้นสุดของแนวโน้มได้เร็วขึ้น ช่วยในการปรับกลยุทธ์ได้ทันท่วงที
- การผสมผสานกับตัวบ่งชี้อื่น: ZLEMA ทำงานได้ดีเมื่อใช้ร่วมกับตัวบ่งชี้ทางเทคนิคอื่น ๆ เช่น RSI, MACD หรือการวิเคราะห์รูปแบบราคา เพื่อเพิ่มความแม่นยำของสัญญาณ โดยเฉพาะอย่างยิ่งเมื่อใช้ร่วมกับตัวบ่งชี้ติดตามแนวโน้ม เช่น ค่าเฉลี่ยเคลื่อนที่ เพื่อยืนยันการเบรคเอาต์หรือการกลับตัวของราคา
- การยืนยันการเบรคเอาต์และการกลับตัว: ZLEMA สามารถช่วยยืนยันการเบรคเอาต์ของราคาจากระดับสำคัญหรือสัญญาณการกลับตัว เช่น เมื่อราคาตัดผ่านเส้น ZLEMA อาจบ่งชี้ถึงการเปลี่ยนแปลงแนวโน้ม และในทางกลับกัน
- การลดเสียงรบกวน: เนื่องจากลดดีเลย์ ZLEMA จึงสามารถกรองเสียงรบกวนที่อาจเกิดขึ้นในค่าเฉลี่ยเคลื่อนที่แบบดั้งเดิมได้ดีขึ้น ทำให้เป็นเครื่องมือสำคัญในการเทรดภายในวันหรือในตลาดที่มีความผันผวนสูง
เคล็ดลับในการใช้ ZLEMA
- ปรับช่วงเวลา: ปรับช่วงเวลาของ ZLEMA ตามสไตล์การเทรดและความผันผวนของตลาด สำหรับการเทรดระยะสั้น ใช้ช่วงเวลาสั้นกว่า (เช่น 10 หรือ 14) ส่วนการติดตามแนวโน้มระยะยาว ช่วงเวลาที่ยาวกว่า (เช่น 50 หรือ 100) อาจเหมาะสมกว่า
- ผสมผสานกับเครื่องมืออื่น: แม้ว่า ZLEMA จะมีความสามารถในการติดตามแนวโน้มที่ยอดเยี่ยม การใช้ร่วมกับตัวบ่งชี้อื่น เช่น RSI สำหรับสภาวะซื้อมาก/ขายมาก หรือ MACD สำหรับความแข็งแกร่งของแนวโน้ม จะช่วยเพิ่มความแม่นยำ
- การทดสอบและปรับแต่ง: ประสิทธิภาพของ ZLEMA อาจแตกต่างกันไปตามสภาวะตลาดต่าง ๆ แนะนำให้ทดสอบย้อนหลังและปรับแต่งอย่างละเอียดก่อนใช้งานจริง เพื่อให้ได้ผลลัพธ์ที่ดีที่สุดในกลยุทธ์ของคุณ
สรุป
สรุปโดย AI
The Zero Lag Exponential Moving Average (ZLEMA) is an advanced technical indicator designed to improve upon the traditional Exponential Moving Average (EMA) by reducing lag. It achieves faster response times to price changes while maintaining the smoothing effect of EMA, making it suitable for capturing quick market shifts and trends, especially in volatile or fast-moving markets.
Key features include:
- Zero lag response for timely reaction to price fluctuations.
- Smoothness that filters out noise without sacrificing responsiveness.
- Flexibility to use various price data inputs such as Close, Open, or High prices.
- Utility in trend following and confirming reversal signals.
ZLEMA is particularly useful for short-term traders seeking to capture rapid trend reversals or breakouts, as well as for longer-term trend tracking with enhanced sensitivity compared to EMA. It can be combined with other indicators like RSI or MACD to improve signal accuracy and confirm price breakouts or reversals.
Users can adjust the indicator’s period to match their trading style and market conditions, optimizing performance through backtesting. ZLEMA helps reduce noise and lag, making it a valuable tool for intraday and volatile market trading.
โปรไฟล์อินดิเคเตอร์
รีวิวจากลูกค้า
0.0
รีวิว: 0
รีวิวจากลูกค้า
ยังไม่มีรีวิวสำหรับผลิตภัณฑ์นี้ หากเคยลองแล้ว ขอเชิญมาเป็นคนแรกที่บอกคนอื่น!
การสนทนา
คำถามที่พบบ่อย
ผลิตภัณฑ์ที่มีให้บริการผ่าน cTrader Store รวมถึงบอทการเทรด อินดิเคเตอร์ และปลั๊กอิน มีให้บริการโดยนักพัฒนาบุคคลที่สามและมีไว้เพื่อวัตถุประสงค์ในการเข้าถึงข้อมูลและทางเทคนิคเท่านั้น cTrader Store ไม่ใช่โบรกเกอร์และไม่ได้ให้คำแนะนำการลงทุน คำแนะนำส่วนบุคคล หรือการรับประกันผลการดำเนินงานในอนาคต


ราคา
ตั้งแต่ 14/07/2025
259
ติดตั้งฟรี