Описание
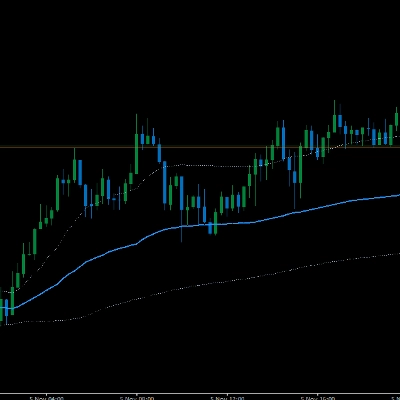
Профессиональный VWAP, который всегда рассчитывается на данных M1 — независимо от того, на каком графике вы находитесь — отображая ежедневные, недельные и месячные якоря одновременно с опциональными полосами и полностью редактируемыми цветами и толщиной.
Совместим с графиками Renko и Heikin Ashi
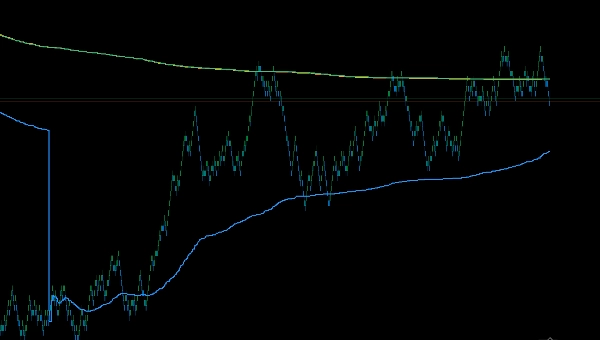
Мульти-якорный VWAP (движок M1)
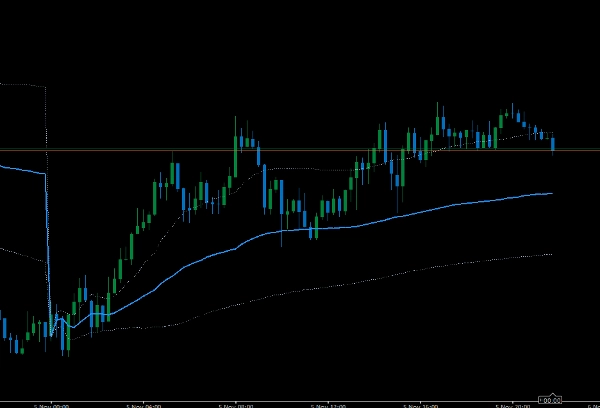
Точный VWAP, созданный для трейдеров, которые требуют точного закрепления и чистой визуализации. Индикатор внутренне использует 1-минутные бары для своих вычислений, поэтому вы можете просматривать или торговать на любом таймфрейме или типе графика (время, тики, диапазон, Renko, Heikin-Ashi) — ваши VWAP остаются последовательными.
Ключевые особенности
- Настоящий движок VWAP M1: вычисления основаны на данных с интервалом 1 минута для стабильных результатов на всех графиках.
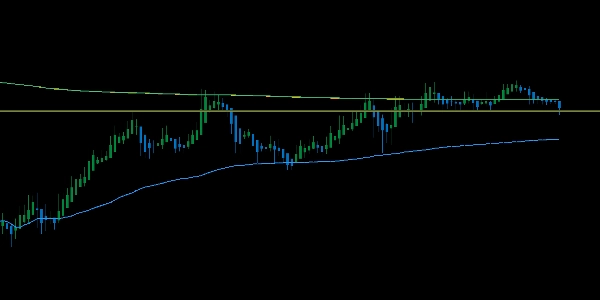
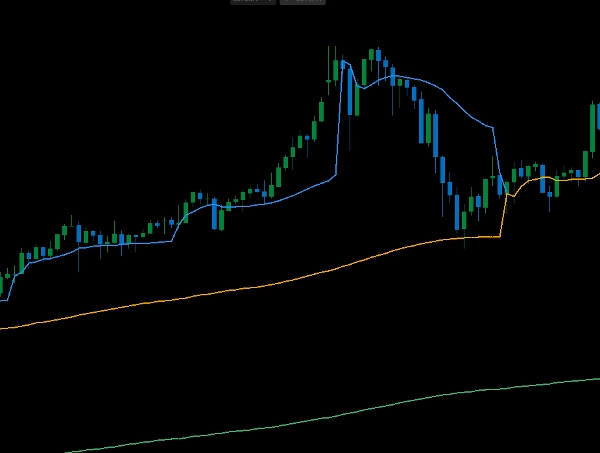
- 3 якоря одновременно: Ежедневный, Недельный, Месячный — идеально для институциональных уровней и многотаймфреймного совпадения.
- Включение/выключение полос для каждого якоря: переключайте полосы и устанавливайте множитель для каждого таймфрейма (0 = скрыть).
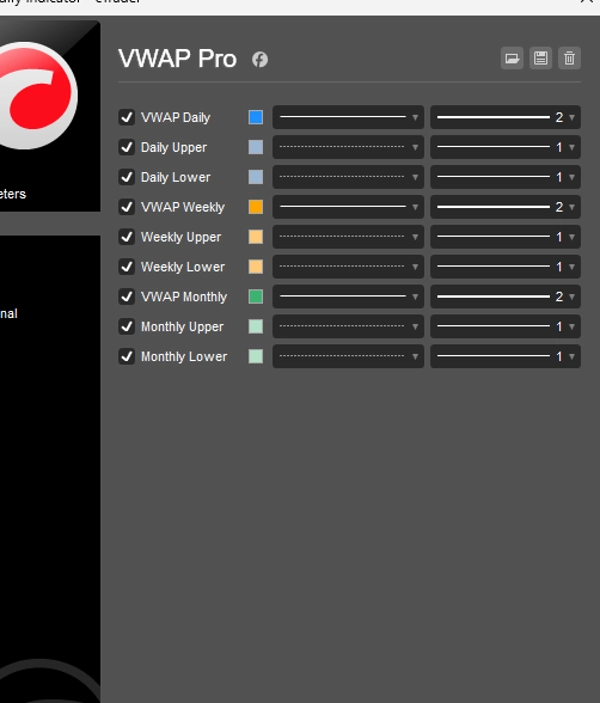
- Настройка линий: редактируйте цвет и толщину для каждого VWAP прямо в настройках индикатора.
- Умные сбросы: автоматические границы дня/недели/месяца (ISO/неделя с понедельника), без лишних настроек.
- Легковесный: оптимизированные кумулятивные вычисления; минимальная нагрузка на процессор.
Почему вам это понравится
- Торгуйте на любом графике/таймфрейме без дрейфа VWAP.
- Сразу видьте зоны цен более высоких таймфреймов.
- Чистый, настраиваемый вид, который подходит под ваш шаблон.
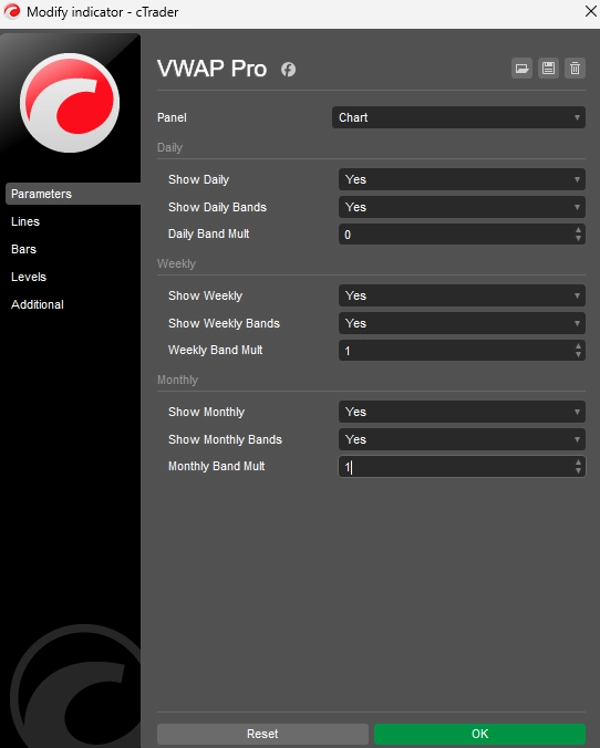
Входные параметры (быстрые)
- Видимость: показывать ежедневные / недельные / месячные
- Полосы: показывать ежедневные/недельные/месячные полосы, множитель полосы для каждого якоря
- Стилизация: для каждого якоря цвет и толщина (через стили вывода)
Примечания
- Требуется у брокера история M1; первые бары могут показывать
NaN, пока не загрузится достаточно данных M1. - Использует взвешивание по TickVolume (универсально доступно в символах cTrader).
Лучше всего подходит для
Скальперов, внутридневных и свинг-трейдеров, выравнивающих входы с VWAP сессии/дня/недели/месяца и полосами стандартного отклонения.
Это не финансовый совет, это пользовательский индикатор, который я использую и считаю, что он может быть полезен кому-то еще.
Ваши результаты — ваша ответственность.
Сводка
Отзывы покупателей
5 | 0 % | |
4 | 100 % | |
3 | 0 % | |
2 | 0 % | |
1 | 0 % |


![Логотип продукта "Gaussian Channel [Iridio Capital]"](https://cdn.ctrader.com/image/webp/7c039209-5573-4a54-a072-f9528b503103_41960)


