
FULL MARKET VIEW DASHBOARD (Forex and Crypto). Prop firm pass✅
Bu video hakkında
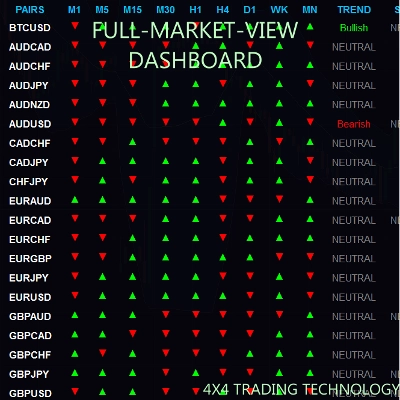
read me. risk manager included 0$. 70% accurate. fully tested for 8 months. leave us a review 🧭 FULL-MARKET-VIEW-DASHBOARD 🧭 The Command Center for Algorithmic Precision The FULL-MARKET-VIEW-DASHBOARD is a professional-grade trading suite for cTrader that eliminates market noise and enforces institutional-level discipline. By merging a 9-Timeframe Consensus Engine with a Trend-Stacked Risk Manager, it provides a 360-degree view of the Forex market in real-time. 🗳️ The Rule of 7 (Multi-Timeframe Logic) Most indicators fail because they only see one slice of time. The FULL-MARKET-VIEW-DASHBOARD scans M1, M5, M15, M30, H1, H4, D1, WK, and MN simultaneously. Bullish/Bearish: Only triggered when a "Super-Majority" of 7 out of 9 timeframes agree on the candle direction. Neutral Filter: If the market is fragmented, the dashboard stays NEUTRAL, keeping you out of dangerous, choppy ranges. ⛓️ Trend Stacking & Baseline Filtering The dashboard doesn't just look for a cross; it looks for a Stack. Signal Alignment: A BUY or SELL signal is only generated when the 10 EMA -20 EMA -200 EMA (for Buys) or vice versa (for Sells). The 200 EMA "God-Line": Every trade is filtered through the 200 EMA baseline to ensure you are always trading with the dominant macroeconomic flow. 🛡️ Precision Risk Manager (Zero-Repaint) Once you click a pair’s TRADE button, the dashboard teleports you to that chart where the local execution engine takes over: Closed-Candle Lock: Signals are calculated at the close of the candle, ensuring your entry point is an immutable historical fact—it will never wiggle or move with the live price. Vector Rays: Entry, Stop Loss, and Take Profit lines anchor to the signal candle and shoot infinitely to the right, providing a clear visual target path. ATR-Volatility Adjusted: Stop Loss levels aren't random; they are mathematically calculated based on the market's current "breath" (ATR). ☁️ Visual Intelligence Bollinger Band Clouds: Beautiful, customizable clouds help you visualize the "volatility envelope" and identify overextended price points. Impact Matrix: A dynamic column that measures the daily "gas in the tank" (Change %), labeling momentum as Build-up, Good, or Excellent. ⚡ Technical Specs Feature Logic Strategy EMA Trend Stacking + MTF Consensus Safety ATR-Based SL + 200 EMA Baseline Filter Performance Dashboard Toggle for Low-Memory Usage Execution Instant Chart-Switching via TRADE Buttons FULL-MARKET-VIEW-DASHBOA