
Ichimocku Histogram and Candles - Muravha
Gösterge
Sürüm 1.0, Aug 2026
Windows, Mac
4.0
Değerlendirmeler: 1

4.15M
İşlem hacmi
39.99K
Kazanılan pip
1
Satışlar
Açıklama
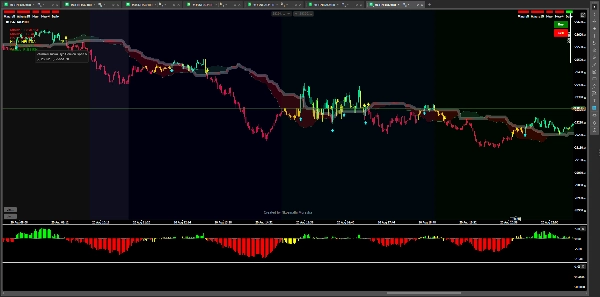
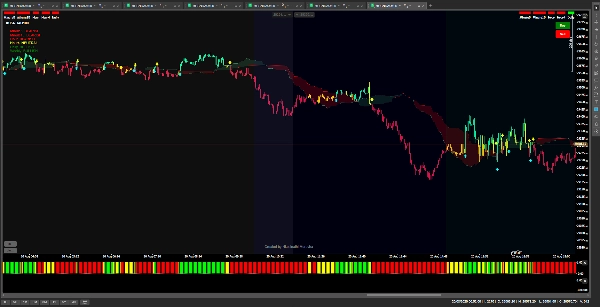
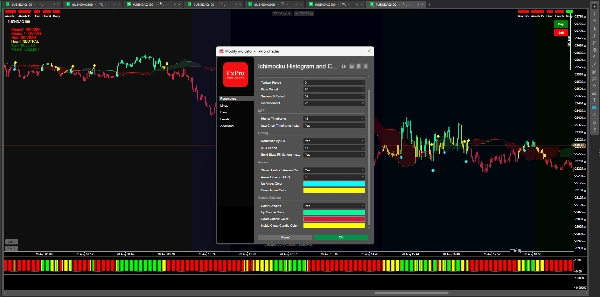
Gösterge adı temel alınarak “Ichimocku Histogram ve Mumlar”, amacı esasen Ichimoku tarzı trend analizini histogram/mum görselleştirmesiyle birleştirmektir:
- Trend yönü: Piyasanın boğa mı ayı mı olduğunu belirlemeye yardımcı olur.
- Momentum: Histogram, boğa veya ayı momentumu güçleniyor mu zayıflıyor mu gösterir.
- Mum sinyalleri: Renk/görünüm değişiklikleri potansiyel momentum değişimlerini görmeyi kolaylaştırabilir.
- Ticaret fırsatları: Tüccarlar momentum değişiklikleri, trend devamı ve potansiyel dönüşler arayabilir, ideal olarak fiyat hareketi ve daha yüksek zaman dilimi yapısıyla doğrulanır.
- Ticaret filtreleme: Her sinyali almak yerine, gösterge tüccarların trend + momentumun uyumlu olduğu kurulumlara odaklanmasına yardımcı olabilir.
Basitçe söylemek gerekirse: piyasanın trend ve momentumu görsel olarak daha kolay okunabilir hale getirilmek üzere tasarlanmıştır, tüccarların potansiyel giriş ve çıkış alanlarını belirlemesine yardımcı olur.
Özet
YZ özeti
Ichimocku Histogram and Candles - Muravha is a trading indicator that integrates Ichimoku-style trend analysis with histogram and candle visualizations. It provides a visual representation of market trend direction, indicating whether the market is bullish or bearish. The histogram component displays momentum strength, showing whether bullish or bearish momentum is increasing or decreasing. Candle color and appearance changes highlight potential momentum shifts, making it easier to identify trade signals. The indicator helps traders spot potential buy and sell opportunities by signaling momentum changes, trend continuation, and possible reversals. It also assists in filtering trades by focusing on setups where trend and momentum align, supporting more informed decision-making. This tool is designed to simplify reading market trends and momentum visually, aiding traders in identifying potential entry and exit points. It supports analysis based on price action and higher-timeframe structure confirmation. The indicator outputs include filters, signals, and visualizations, and it supports signal types such as breakouts, trend strength, volatility regimes, level breaks, and reversals. It requires bar and volume data for operation.
Gösterge profili
Gösterge kategorisi
Momentum
Çıktı türü
Filtre
Sinyaller
Görselleştirme
Veri gereklilikleri
Yalnızca çubuklar
Hacim
Desteklenen sinyaller
Kırılma
Trend gücü
Volatilite
Seviye kırılması
Yön değiştirme
Tartışma
Müşteri değerlendirmeleri
4.0
Değerlendirmeler: 1
5 | 0 % | |
4 | 100 % | |
3 | 0 % | |
2 | 0 % | |
1 | 0 % |
Müşteri değerlendirmeleri
October 12, 2026
Histogram and candle colours offer a simpler visual reading of Ichimoku direction without the full cloud. The description does not establish concrete settings or measured accuracy, so the supported scope remains a visual trend aid rather than a proven entry edge.
SSS
Ichimoku
cTrader Store üzerinden erişilebilen işlem botları, göstergeler ve eklentiler gibi ürünler, üçüncü taraf sağlayıcılar tarafından sağlanır ve yalnızca bilgilendirme ve teknik erişim amaçlarıyla sunulur. cTrader Store bir broker değildir ve yatırım tavsiyesi, kişisel öneriler vermez veya gelecekteki performansı garanti etmez.
Bu oluşturanın diğer ürünleri



Fiyat
4.15M
İşlem hacmi
39.99K
Kazanılan pip
1
Satışlar