Açıklama
Dr. Chanlun Structure Indicator for cTrader, cTrader grafiklerinde Chanlun yapıları göstermek için kullanılan bir piyasa yapısı / grafik üstü teknik analiz göstergesidir.
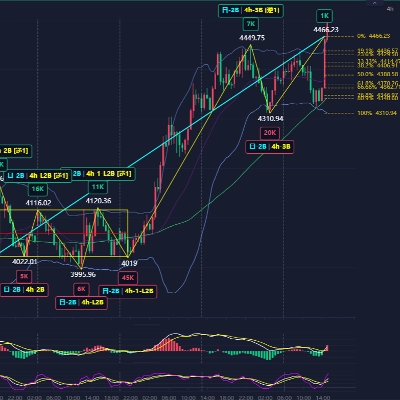
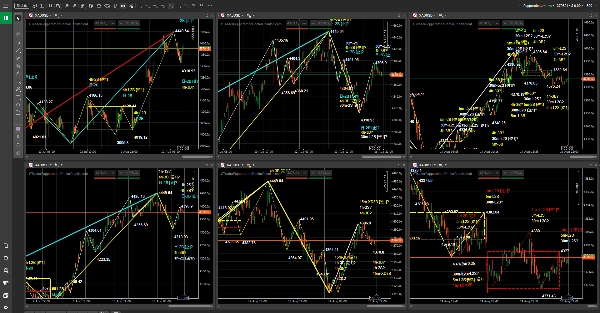
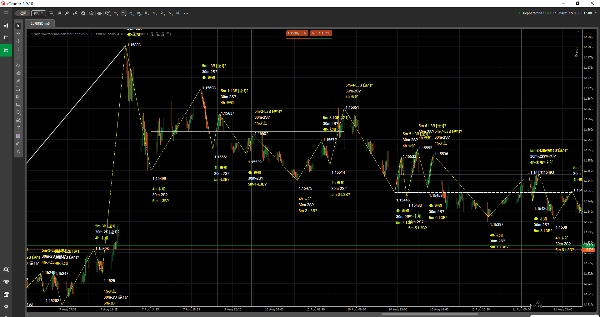
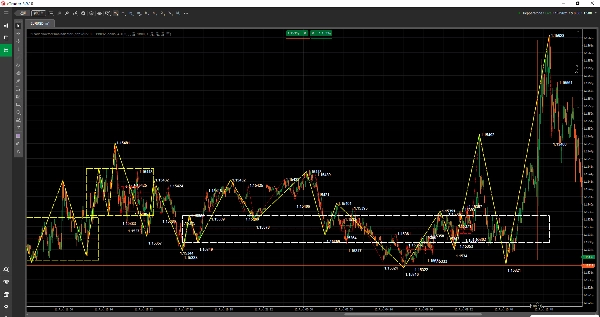
Fiyat hareketine, trend yapısına ve çoklu zaman dilimi analizine odaklanan tüccarlar için uygundur. Gösterge, Bi yapıları, Zhongshu bölgeleri, alım/satım işaretçileri ve daha fazlası dahil olmak üzere ana Chanlun yapılarını grafik nesneleri olarak gösterir ve kullanıcılara piyasa ritmini, yapısal değişiklikleri ve farklı zaman dilimleri arasındaki ilişkileri daha sezgisel olarak gözlemlemeye yardımcı olur.
Bu gösterge otomatik bir işlem robotu değildir ve bir işlem sinyali hizmeti değildir. Amacı, kullanıcılara grafik okumada, piyasaları gözden geçirmede ve işlem planları oluşturmada daha net yardımcı olmaktır.
Mevcut sürüm, belirtilen Pepperstone cTrader sembolleri ve zaman dilimleri ile uyumludur. Bu ürün bağımsız bir üçüncü taraf göstergesidir ve resmi bir Pepperstone ürünü veya Pepperstone ortak ürünü değildir.
Gösterge genel bakışı
- Gösterge türü: piyasa yapısı / grafik üstü gösterge.
- Tercih edilen enstrümanlar: Pepperstone cTrader'da belirtilen Forex, endeksler, emtialar, kripto paralar ve hisse senedi CFD sembolleri.
- Tercih edilen zaman dilimleri: 1 dakika, 5 dakika, 15 dakika, 30 dakika, 1 saat, 4 saat, günlük, haftalık ve aylık.
- İşlem kullanım durumu: grafik yapısı gözlemi, çoklu zaman dilimi analizi, işlem planı hazırlama ve gözden geçirme desteği.
Grafikte görebilecekleriniz
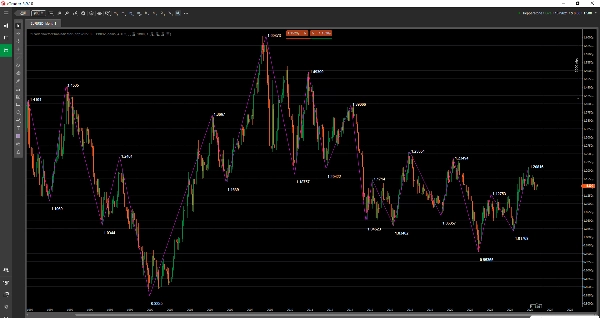
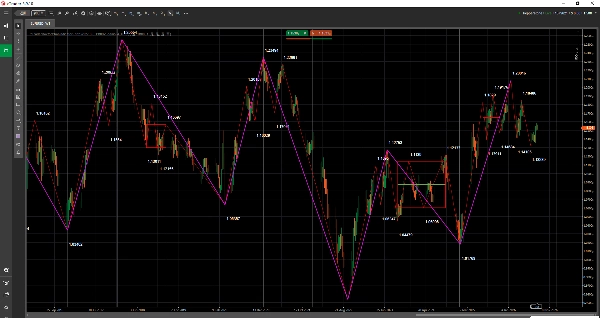
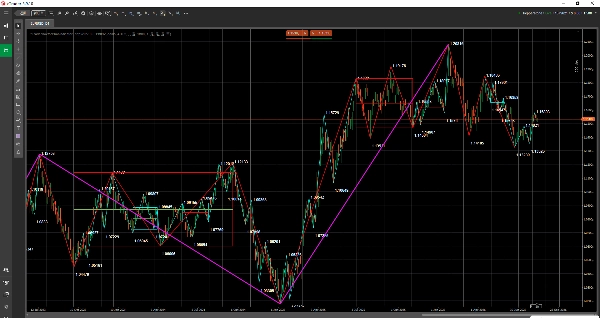
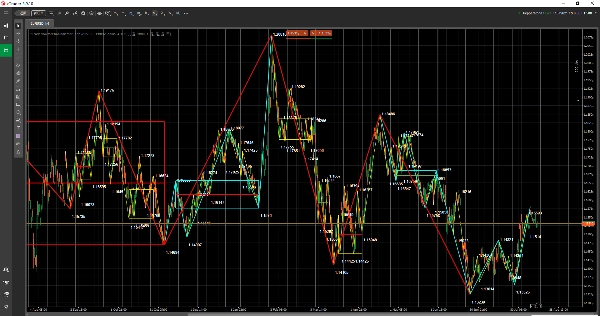
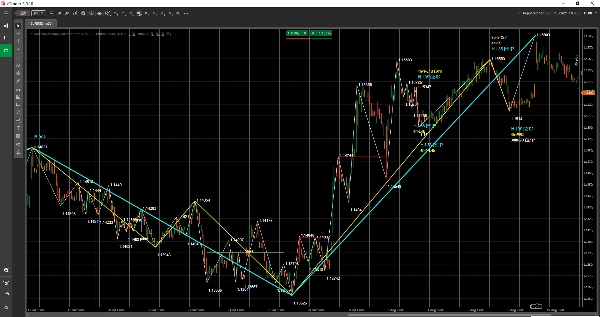
- Bi yapıları: salınım ritmi ve yapısal ilerlemeyi gözlemlemek için kullanılır.
- Zhongshu bölgeleri: önemli konsolidasyon, denge ve yapısal örtüşme alanlarını gözlemlemek için kullanılır.
- Alım/satım işaretçileri: ana yapısal referans noktalarını bulmaya yardımcı olur.
- Metin etiketleri, yatay çizgiler, dikey çizgiler, dikdörtgen alanlar, trend çizgileri ve diğer grafik nesneleri.
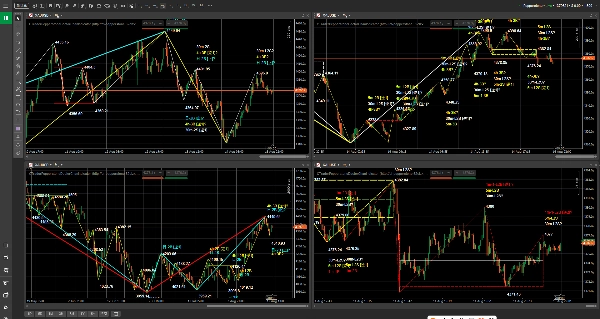
- Mevcut grafik zaman dilimi ile otomatik veri eşleştirme varsayılan olarak desteklenir, bu da çoklu zaman dilimi gözlemini kolaylaştırır.
Bu gösterge kimler içindir
- Dr. Chanlun Structure Indicator ve Chanlun yapı analizini öğrenen veya kullanan kullanıcılar.
- Yapı bilgilerini doğrudan cTrader grafiklerinde görmek isteyen kullanıcılar.
- Pepperstone kullanarak Forex, endeksler, emtialar, kripto paralar veya hisse senedi CFD'lerini görüntüleyen kullanıcılar.
- Farklı zaman dilimleri arasında trend yapısını karşılaştırması gereken tüccarlar.
- Grafik okuma, planlama ve gözden geçirme iş akışlarını daha net yapmak isteyen kullanıcılar.
Erişim ve lisanslama
Ürün erişimi ve lisanslama, cTrader Store satın alma, deneme ve kurulum süreciyle yönetilir. Lütfen cTrader Store ürün sayfasında gösterilen satın alma durumu, deneme durumu ve ürün bilgilerine bakınız.
Şu anda desteklenen Pepperstone sembolleri
Forex:
GBPUSD, EURUSD, USDJPY, USDCHF, AUDUSD, USDCAD, GBPJPY
Endeksler:
US500, NAS100, GER40, UK100, JPN225, VIX, HSTECH
Emtialar:
XAUUSD, XAGUSD
Kripto Paralar:
BTCUSD, ETHUSD
Hisseler:
AAPL.US-24, MSFT.US-24, GOOG.US-24, AMZN.US-24, TSLA.US-24, NVDA.US-24, META.US-24, NFLX.US-24, JPM.US-24
Desteklenen zaman dilimleri
1 dakika, 5 dakika, 15 dakika, 30 dakika, 1 saat, 4 saat, günlük, haftalık ve aylık.
Önerilen iş akışı
1. Pepperstone cTrader ortamında desteklenen bir sembol için grafik açın.
2. Dr. Chanlun Structure Indicator'ı grafiğe yükleyin.
3. Dr. Chanlun Structure Indicator veri zamanı UTC+0'dır. Grafik yapılarını kontrol ederken, pozisyonları karşılaştırmadan önce cTrader grafik zaman dilimini ilgili zaman dilimine değiştirdiğinizden emin olun.
4. Mevcut grafik zaman diliminin desteklendiğinden emin olun. Gösterge verileri otomatik olarak grafik zaman dilimi ile eşleştirir.
5. İhtiyaca göre "Show Bi", "Show Zhongshu" ve "Show Buy/Sell" seçeneklerini açıp kapatın.
6. Grafik yapısını kendi işlem planınız, pozisyon yönetiminiz ve risk kontrolünüzle birlikte gözlemleyin.
Parametre ayarları
Mevcut sürüm, cTrader gösterge panelinde yalnızca aşağıdaki 3 görünür parametreyi sunar. Veri zaman dilimi, broker sembol eki, önbellek, yenileme, sıkıştırılmış transfer ve günlük kaydı ayarları gösterge tarafından dahili olarak yönetilir ve normal kullanım için yapılandırılmasına gerek yoktur.
Show Bi
Varsayılan değer: "true"
Bi yapılarını gösterip göstermeme.
Show Zhongshu
Varsayılan değer: "true"
Zhongshu bölgelerini gösterip göstermeme.
Show Buy/Sell
Varsayılan değer: "true"
Alım/satım işaretçilerini gösterip göstermeme.
Önemli notlar
- Bu ürün teknik analiz yardımcı göstergesidir, otomatik işlem robotu değildir.
- Gösterge otomatik olarak emir vermez.
- Gösterge yatırım tavsiyesi, işlem sinyali hizmeti veya kar garantisi oluşturmaz.
- Mevcut sürüm yalnızca belirtilen Pepperstone cTrader sembolleri ve belirtilen zaman dilimleri ile uyumludur.
- Dr. Chanlun Structure Indicator veri zamanı UTC+0'dır. cTrader grafiğinde görüntülerken, yapı pozisyonlarını kontrol etmeden önce ilgili grafik zaman dilimine geçiniz.
- Kullanıcılar bunu kendi işlem planları, pozisyon yönetimi, risk kontrolü ve bağımsız yargıları ile birlikte kullanmalıdır.
Gelecek güncelleme yönü
Mevcut sürüm, belirtilen Pepperstone cTrader sembolleri ve zaman dilimlerine öncelik verir. Gelecek güncellemeler, ürün planına göre daha fazla broker, daha fazla sembol eşlemesi ve daha kapsamlı bir veri hizmeti kapsamı eklemeye devam edebilir.
Risk uyarısı
Finansal piyasa işlemleri risk içerir. Geçmiş performans gelecekteki sonuçları garanti etmez. Bu gösterge yalnızca teknik analiz ve öğrenme yardımcı aracıdır. Yatırım tavsiyesi, işlem sinyali hizmeti veya kar garantisi oluşturmaz. Tarihsel yapılar gelecekteki sonuçları temsil etmez. Kullanıcılar bunu kendi işlem ortamlarında tam olarak test etmeli ve risk yönetimi kuralları ile birlikte dikkatli kullanmalıdır.
Özet
This tool is intended for traders focusing on price action, trend structure, and multi-timeframe analysis. It supports automatic data matching to the current chart timeframe, facilitating easier multi-timeframe observation. Users can toggle the display of Bi structures, Zhongshu zones, and buy/sell markers according to their preferences.
Dr. Chanlun Structure is a technical analysis assistant and does not provide automated trading or trading signals. It requires users to apply their own trading plans, risk management, and judgment. The indicator is compatible with specified Pepperstone cTrader symbols and timeframes and uses UTC+0 data time, requiring appropriate chart timezone settings for accurate structure alignment.