present
Sign up and get $50 off your first purchase
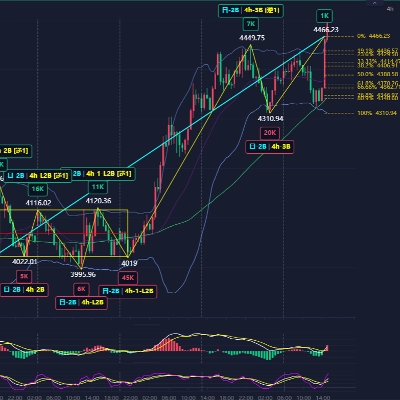
Trading product for Boshi Chanlun Structure Indicator ADX Key Levels, image 1
Boshi Chanlun Structure
Indicator
Version 1.0, Sep 2026
Windows, Mac
Trading product for Boshi Chanlun Structure Indicator ADX Key Levels, image 2
Trading product for Boshi Chanlun Structure Indicator ADX Key Levels, image 3
Trading product for Boshi Chanlun Structure Indicator ADX Key Levels, image 4
Trading product for Boshi Chanlun Structure Indicator ADX Key Levels, image 5
Trading product for Boshi Chanlun Structure Indicator ADX Key Levels, image 6
Trading product for Boshi Chanlun Structure Indicator ADX Key Levels, image 7
Trading product for Boshi Chanlun Structure Indicator ADX Key Levels, image 8
Trading product for Boshi Chanlun Structure Indicator ADX Key Levels, image 9
Trading product for Boshi Chanlun Structure Indicator ADX Key Levels, image 10
Since 10/08/2026

Description

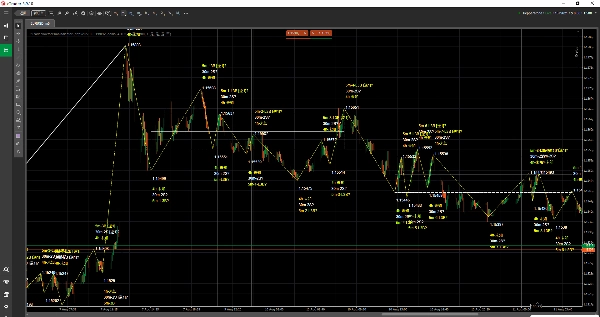
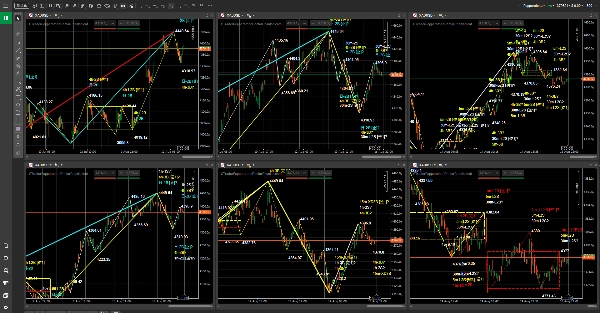
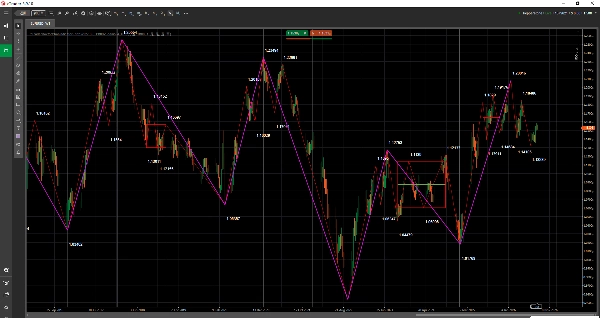
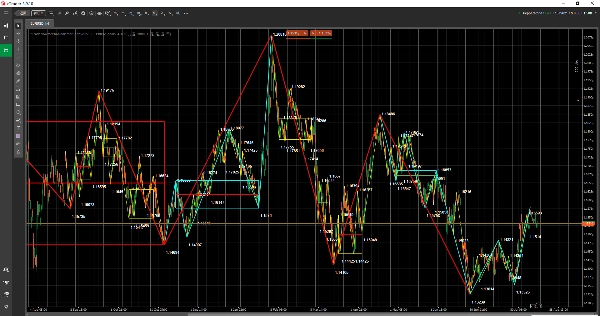
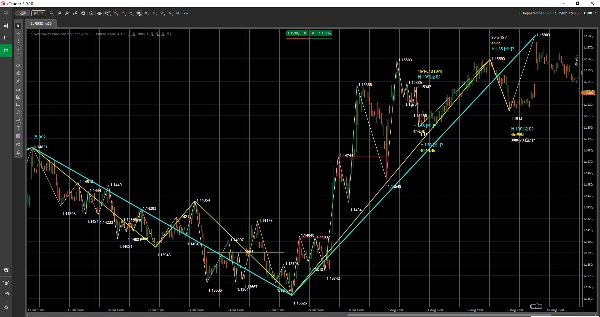
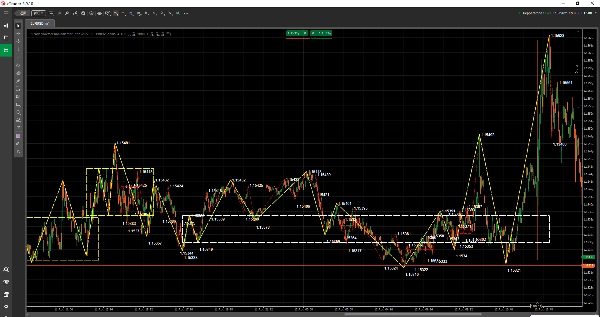
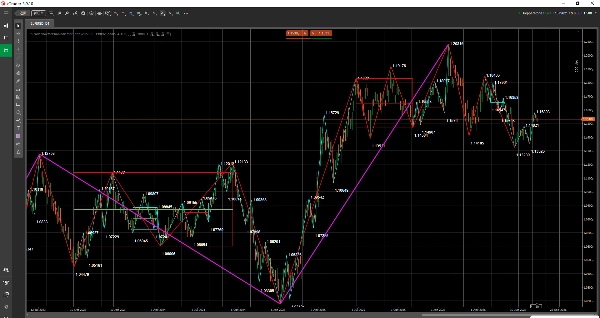
Dr. Chanlun Structure Indicator for cTrader is a market structure / chart overlay technical analysis indicator used to display Chanlun structures on cTrader charts.


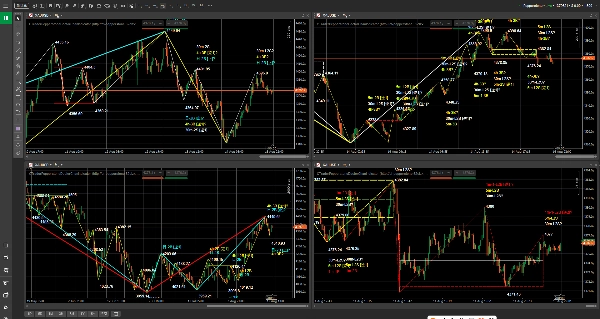
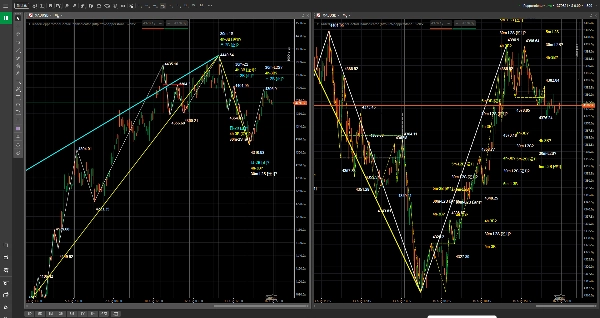
It is suitable for traders who focus on price action, trend structure and multi-timeframe analysis. The indicator displays key Chanlun structures as chart objects, including Bi structures, Zhongshu zones, buy/sell markers and more, helping users observe market rhythm, structural changes and relationships between different timeframes more intuitively.


This indicator is not an automated trading robot and is not a trading signal service. Its purpose is to help users read charts, review markets and build trading plans more clearly.


The current version is compatible with specified Pepperstone cTrader symbols and timeframes. This product is an independent third-party indicator and is not an official Pepperstone product or a Pepperstone partner product.


Indicator overview


- Indicator type: market structure / chart overlay indicator.

- Preferred instruments: specified Forex, indices, commodities, cryptocurrencies and stock CFD symbols in Pepperstone cTrader.

- Preferred timeframes: 1 minute, 5 minutes, 15 minutes, 30 minutes, 1 hour, 4 hours, daily, weekly and monthly.

- Trading use case: chart structure observation, multi-timeframe analysis, trading plan preparation and review support.


What you can see on the chart


- Bi structures: used to observe swing rhythm and structural progression.

- Zhongshu zones: used to observe important consolidation, balance and structural overlap areas.

- Buy/sell markers: used to help locate key structural reference points.

- Text labels, horizontal lines, vertical lines, rectangular areas, trend lines and other chart objects.

- Automatic data matching with the current chart timeframe is supported by default, making multi-timeframe observation easier.


Who this indicator is for


- Users who are learning or using Dr. Chanlun Structure Indicator and Chanlun structure analysis.

- Users who want to view structure information directly on cTrader charts.

- Users who use Pepperstone to view Forex, indices, commodities, cryptocurrencies or stock CFDs.

- Traders who need to compare trend structures across different timeframes.

- Users who want to make chart reading, planning and review workflows clearer.


Access and licensing


Product access and licensing are managed through the cTrader Store purchase, trial and installation process. Please refer to the purchase status, trial status and product information shown on the cTrader Store product page.


Currently supported Pepperstone symbols


Forex:

GBPUSD, EURUSD, USDJPY, USDCHF, AUDUSD, USDCAD, GBPJPY


Indices:

US500, NAS100, GER40, UK100, JPN225, VIX, HSTECH


Commodities:

XAUUSD, XAGUSD


Cryptocurrencies:

BTCUSD, ETHUSD


Stocks:

AAPL.US-24, MSFT.US-24, GOOG.US-24, AMZN.US-24, TSLA.US-24, NVDA.US-24, META.US-24, NFLX.US-24, JPM.US-24


Supported timeframes


1 minute, 5 minutes, 15 minutes, 30 minutes, 1 hour, 4 hours, daily, weekly and monthly.


Suggested workflow


1. Open a chart for a supported symbol in the Pepperstone cTrader environment.

2. Load Dr. Chanlun Structure Indicator onto the chart.

3. The Dr. Chanlun Structure Indicator data time is UTC+0. When checking chart structures, make sure to switch the cTrader chart time zone to the corresponding time zone before comparing positions.

4. Make sure the current chart timeframe is supported. The indicator automatically matches data to the chart timeframe.

5. Turn "Show Bi", "Show Zhongshu" and "Show Buy/Sell" on or off as needed.

6. Observe the chart structure together with your own trading plan, position management and risk control.


Parameter settings


The current version exposes only the following 3 visible parameters in the cTrader indicator panel. Data timeframe, broker symbol suffix, cache, refresh, compressed transfer and logging settings are managed internally by the indicator and do not need to be configured for normal use.


Show Bi


Default value: "true"


Whether to display Bi structures.


Show Zhongshu


Default value: "true"


Whether to display Zhongshu zones.


Show Buy/Sell


Default value: "true"


Whether to display buy/sell markers.


Important notes


- This product is a technical analysis assistant indicator, not an automated trading robot.

- The indicator does not place orders automatically.

- The indicator does not constitute investment advice, a trading signal service or a profit guarantee.

- The current version is compatible only with specified Pepperstone cTrader symbols and specified timeframes.

- The Dr. Chanlun Structure Indicator data time is UTC+0. When displaying it on a cTrader chart, please switch to the corresponding chart time zone before checking structure positions.

- Users should use it together with their own trading plan, position management, risk control and independent judgment.


Future update direction


The current release version prioritizes specified Pepperstone cTrader symbols and timeframes. Future updates may continue to expand more brokers, more symbol mappings and a more complete data service scope according to the product plan.


Risk warning


Financial market trading involves risk. Past performance does not guarantee future results. This indicator is only a technical analysis and learning assistant tool. It does not constitute investment advice, a trading signal service or a profit guarantee. Historical structures do not represent future results. Users should fully test it in their own trading environment and use it carefully together with risk management rules.

Summary

Indicator profile
Indicator category
Market structure (SMC)
Output type
Visualisation
Data requirements
Bars only
External data
Supported signals
Cross
Divergence
Breakout
Reversal
Trend strength
Volatility

Customer reviews

0.0
Reviews: 0
Customer reviews
No reviews for this product yet. Already tried it? Be the first to tell others!

Discussion

FAQ

ADX
Key Levels
Market Structure
MACD
Support & Resistance
Products available through cTrader Store, including trading bots, indicators and plugins, are provided by third-party developers and made available for informational and technical access purposes only. cTrader Store is not a broker and does not provide investment advice, personal recommendations or any guarantee of future performance.

You may also like

Indicator
Forex
Crypto
+5
Fixed Range Volume Profile (FRVP) : analyzes price volume within a custom rectangle to find POC, VAH, and VAL.
Indicator
RSI
Key Levels
+3
MARCs Multi-timeframe market dashboard with trend rows, RSI context, sessions, presets and optional chart levels.
Indicator
Drawdown Monitor
Proprietary trading desk risk monitoring dashboard!
Indicator
MultiTF Pivot and SR Indicator
Indicator
Forex
Crypto
+4
Pro Heikin Ashi Visual Overlay – Clean Trend Visualization
Indicator
Forex
Crypto
+4
Block Liquidity,indicator.Block Order, Liquids Stops, Signal Sentiment,signal correction
Indicator
ICT ALL KİLL ZONES, LONDON , ASİA, NY AM, NY LUNCH, NY PM
Indicator
Prop
E7 BBKG indicator with 80% plus accuracy used to show both, possible reversal and trend.
Indicator
Pin Bar
Inducement
+5
Institutional Nasdaq Session Liquidity Map with Live Point HUD, Sweep Alerts & Interactive Playbook.
Indicator
ATR
SMC
+5
Candles Volume Delta is a powerful, visually intuitive indicator that transforms raw tick volume into actionable trading
Indicator
Inside Bar
Save time by lighting a candle to look within yourself in another temporality
Indicator
Forex
BTCUSD
+5
This indicator displays the OrderBlocks of the current and higher timeframe, made by ICT's student.
Indicator
MACD
Forex
+5
MACD Indicator with Histogram that plots Colors Based on Direction Above and Below the Zero Line.
Indicator
ATR
Forex
+7
Final Moving Average is an adaptive system designed to keep traders aligned with the true direction of the market
Indicator
CHOCH
Key Levels
+4
Real-time compliance dashboard for prop firm challenges. Tracks daily loss, max drawdown, and profit target.
"IVB 2.0" logo
Top-rated
4.6
(5)
Indicator
IVB 2.0 is an indicator that works on the strategy of imbalance of the maximum volatility box of indices
"macdZR" logo
Top-rated
4.6
(5)
Indicator
MACD
Forex
+5
MACD ZERO LAG. Get faster signals, earlier trend detection, and eliminate the delay of traditional moving averages
Indicator
BOS
CHOCH
+5
BOS/CHoCH signals confirmed by liquidity sweep + FVG confluence, with a live conviction score.

Price

Since 10/08/2026