
脉冲雷达:专业动量与周期动态分析
该 脉冲雷达 指标是一个针对C#驱动平台的高级分析套件,旨在解码市场波动性并识别高概率的价格发展阶段。与滞后的传统指标不同,脉冲雷达采用自适应的价格均衡区评估,提供清晰的市场结构图。
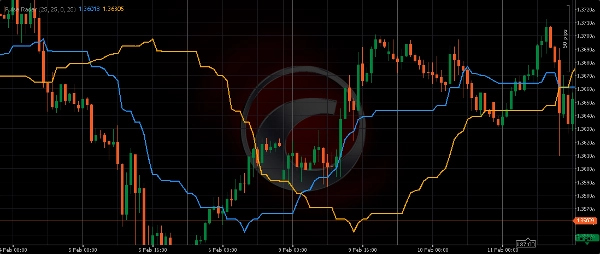
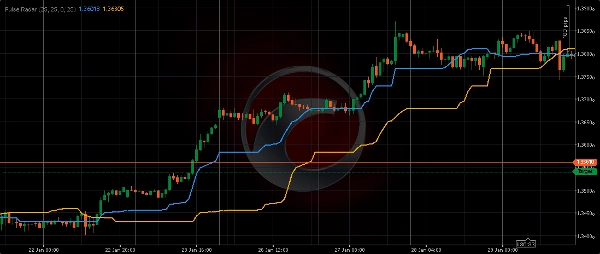
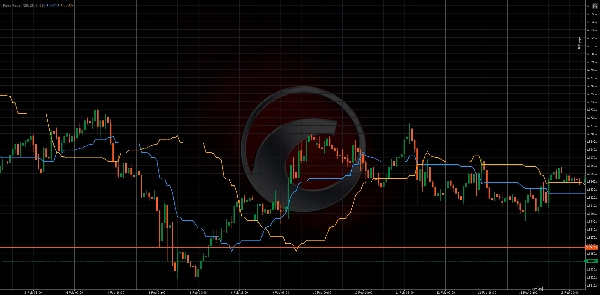
该系统构建了两条专有分析曲线:
- 主动向量(快速): 一条高响应线,反映即时动量和短期流动性变化。
- 战略向量(慢速): 一条平滑曲线,代表主导市场周期和机构价格均衡。
通过分析价格相对于这些曲线的位置,交易者可以准确定位当前市场阶段在更广泛周期层级中的位置。脉冲雷达还具备先进的历史对齐功能,允许直接比较当前结构运动与过去行为模式。
技术方法论
- 极点分析: 线条基于特定回溯窗口内的原始价格极值计算,消除标准移动平均中的噪音。
- 相位同步: 算法支持手动和自动偏移调整,以使数据与历史图表段对齐。
- 结构交互: 主动和战略向量的汇聚与背离突出显示趋势积累与分配阶段的转换。
主要优势
- 零平滑精度: 计算利用原始市场数据,确保不引入人为滞后。
- 自适应框架: 完全可配置参数以匹配任何资产的特定波动性特征。
- 跨市场适用性: 针对高频外汇、美国股票、大宗商品和加密货币进行了优化。
- 高性能架构: 轻量级C#逻辑确保在高波动期间对平台稳定性零影响。
输入参数
- 触达周期(快/慢): 定义用于计算动量向量的市场数据深度。
- 相位偏移(快/慢): 允许对分析线与历史价格结构进行精确校准。
指标配置
5.0
评价:2
5 | 100 % | |
4 | 0 % | |
3 | 0 % | |
2 | 0 % | |
1 | 0 % |
BTCUSD
Forex
Signal
Indices
EURUSD
Commodities
GBPUSD
NZDUSD
Bollinger
Fibonacci
Prop
Scalping
SMC
Crypto
Stocks
XAUUSD
NAS100
ATR
USDJPY
VWAP
cTrader Store 提供的所有产品,包括交易机器人、指标和插件,均由第三方开发者提供,仅供信息参考和技术访问之用。cTrader Store 并非经纪商,不提供投资建议、个人推荐或任何未来业绩保证。


注册日期 17/02/2026