
Volume_Momentum_HeatMap-Liquidity-style
指标
版本 2.0, Apr 2026
Windows 版、Mac 版
4.5
评价:4
说明
为什么这个指标对交易者有价值
- 识别关键水平: POC、VAH 和 VAL 是客观的支撑/阻力水平。
- 基于成交量的交易: 帮助交易者看到流动性集中在哪里。
- 适应性强: 适用于任何时间框架和资产类别(外汇、股票、加密货币等)。
- 可定制: 交易者可以调整设置以适应他们的风格。
- 专业级别: 被机构和散户交易者用于订单流分析。
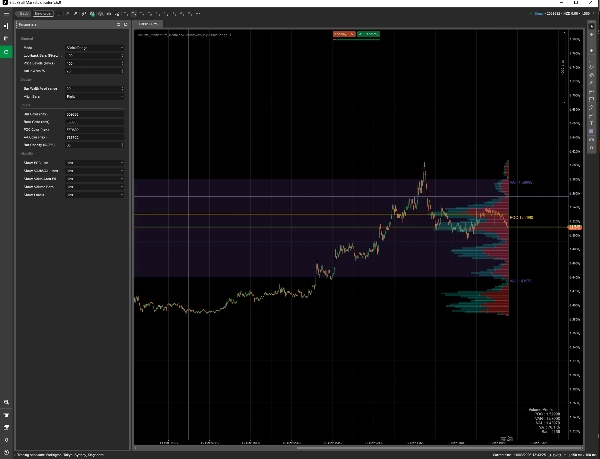
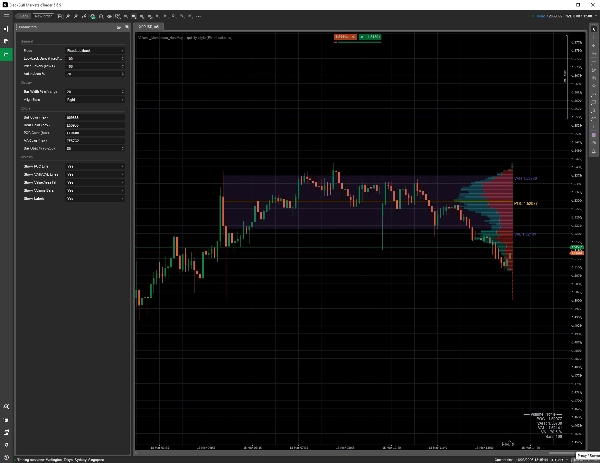
视觉元素 - POC(控制点): 成交量最高的价格水平(黄色线)。对价格有吸引作用。
- VAH/VAL(价值区高/低): 70%价值区(默认)的上限和下限,70%的成交量发生在此区域。该区域通常作为支撑/阻力。
- 价值区填充: VAH 和 VAL 之间的半透明带,视觉上突出显示价值区。
- HVN(高成交量节点): 宽条表示强支撑/阻力区。
- LVN(低成交量节点): 细条表示价格快速移动的区域(突破/止损区)。
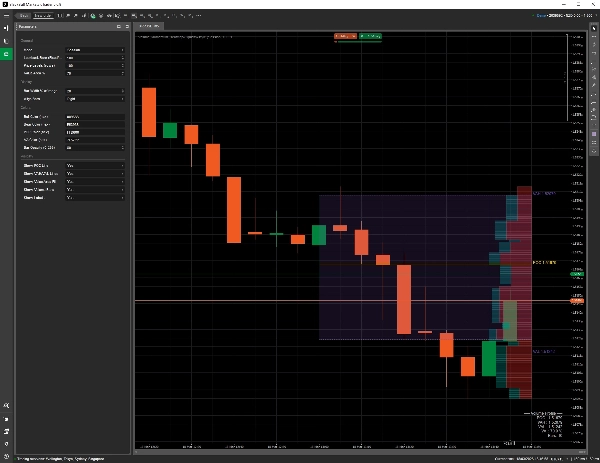
2. 轮廓模式
- 可见范围: 适应当前图表视图(缩放/滚动)。
- 固定回溯: 使用最近的 N 根K线(可配置)。
- 会话: 仅显示当前交易日的成交量。
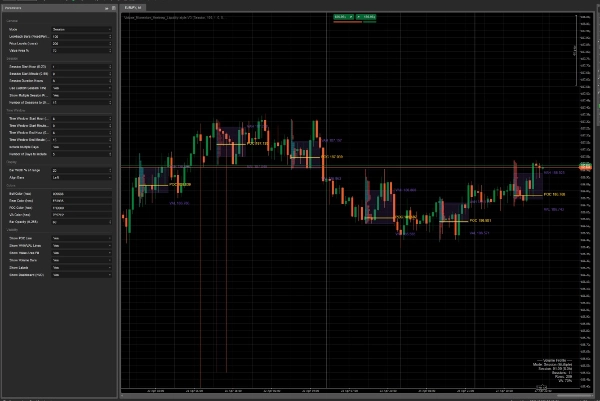
3. 自定义选项
- 行数: 显示的价格水平(行数)。
- 价值区百分比: 调整包含在价值区内的成交量百分比(默认:70%)。
- 柱宽及对齐: 控制成交量柱的宽度和对齐方式。
- 颜色及不透明度: 自定义多头/空头成交量、POC、VA 及不透明度的颜色。
- 可见性: 切换 POC、VAH/VAL、价值区填充、成交量柱和标签的显示/隐藏。
4. 支持的交易策略
- HVN 回撤: 在 POC 或高成交量节点处交易反弹。
- LVN 突破: 当价格突破低成交量节点时进入动量交易。
- 价值区反转: 在价格超出价值区时做反向交易(均值回归)。
- 每日开盘偏向: 将每日开盘价与 POC 比较以判断趋势方向。
潜在买家问题及答案
- 问:它适用于所有时间框架吗?
答:是的,它适应任何时间框架和图表视图。 - 问:我可以更改颜色吗?
答:可以,所有颜色和不透明度均可自定义。 - 问:它适合剥头皮交易吗?
答:绝对适合,尤其是“会话”模式适合日内交易。 - 问:它会重绘吗?
答:不会,只有在有新数据或图表视图变化时才重新计算。
摘要
指标配置
指标分类
动量
输出类型
可视化
数据要求
交易量
支持的信号
波动性
触及水平位
时段开盘区间
客户评价
4.5
评价:4
5 | 50 % | |
4 | 50 % | |
3 | 0 % | |
2 | 0 % | |
1 | 0 % |
客户评价
March 31, 2026
Not some auto win thing, but it has a clear role. It helps with smart money style analysis, while the weak spot is that zones still need manual validation. Early sizing should stay modest until the journal looks stable.
March 24, 2026
Tbh the value is mostly in filtering bad ideas. I still would not trust it live without checking the chart myself. The weak spot shows up when risk stops matching the setup.705 caution area.
March 22, 2026
the product feels more useful when the plan is already written down. A 97 setup run on daily close keeps the review grounded.
March 22, 2026
After 3 sessions, the useful part became clearer. 20 FVG reactions was enough to see whether it helped, and 0.5 mitigation kept the test grounded.
讨论
常见问答
Scalping
cTrader Store 提供的所有产品,包括交易机器人、指标和插件,均由第三方开发者提供,仅供信息参考和技术访问之用。cTrader Store 并非经纪商,不提供投资建议、个人推荐或任何未来业绩保证。
该作者的其他作品

猜您喜欢


价格
注册日期 23/04/2025
2
销售