
Açıklama
SuperTrend Stratejisi**
**SuperTrend** stratejisi, aynı isimli teknik göstergeye (**SuperTrend Göstergesi**) dayanan popüler bir ticaret stratejisidir. Bu gösterge, piyasa trendlerini (yükseliş veya düşüş trendi) belirlemek ve net giriş ve çıkış sinyalleri sağlamak için kullanılır. Trend olan piyasalarda sadeliği ve etkinliği ile bilinir.
---
### **SuperTrend Göstergesinin Bileşenleri**
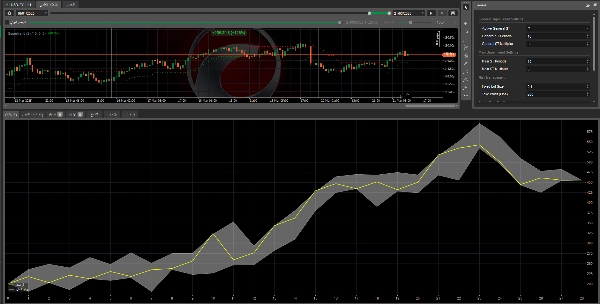
1. **Ortalama Gerçek Aralık (ATR)**:
- Piyasa volatilitesini ölçmek için kullanılır.
- Volatilite ne kadar yüksekse, ATR değeri o kadar yüksek olur.
2. **Çarpan**:
- SuperTrend çizgisinin fiyatla olan mesafesini belirlemek için ATR değeriyle çarpılan bir faktördür.
- Varsayılan değer genellikle 2 ile 4 arasındadır.
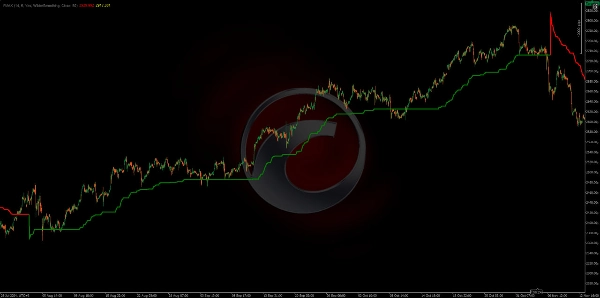
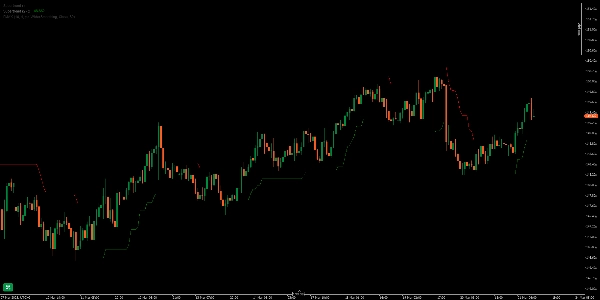
3. **SuperTrend Çizgisi**:
- Fiyat hareketlerine göre ayarlanan dinamik bir çizgidir.
- Fiyat çizginin üzerindeyse, trend yükseliş olarak kabul edilir.
- Fiyat çizginin altındaysa, trend düşüş olarak kabul edilir.
---
### **SuperTrend Göstergesi Nasıl Çalışır?**
1. **Yükseliş Trendi**:
- Fiyat SuperTrend çizgisinin üzerindeyse, trend yükseliş olarak kabul edilir.
- Çizgi fiyatın altında çizilir ve dinamik destek görevi görür.
- Alış Sinyali: Fiyat SuperTrend çizgisini yukarı doğru kestiğinde.
2. **Düşüş Trendi**:
- Fiyat SuperTrend çizgisinin altındaysa, trend düşüş olarak kabul edilir.
- Çizgi fiyatın üzerinde çizilir ve dinamik direnç görevi görür.
- Satış Sinyali: Fiyat SuperTrend çizgisini aşağı doğru kestiğinde.
---
### **Gösterge Ayarları**
- **ATR Periyodu**: Genellikle 10 olarak ayarlanır (zaman dilimine göre ayarlanabilir).
- **Çarpan**: Genellikle 3 olarak ayarlanır (duyarlılığı artırmak veya azaltmak için ayarlanabilir).
---
### **SuperTrend Stratejisinin Avantajları**
1. **Kullanım Kolaylığı**: Gösterge basittir ve net sinyaller sağlar.
2. **Trend Olan Piyasalarda Etkili**: Güçlü trendlerin olduğu piyasalarda iyi çalışır.
3. **Net Giriş ve Çıkış Noktaları**: İşlemlere giriş ve çıkış için kesin sinyaller sağlar.
4. **Özelleştirilebilir**: ATR periyodu ve çarpan, ticaret tarzınıza uyacak şekilde ayarlanabilir.
---
### **SuperTrend Stratejisinin Dezavantajları**
1. **Aralıklı Piyasalarda Etkisiz**:
- Yatay veya aralıklı piyasalarda gösterge yanlış sinyaller verebilir.
2. **Gecikmeli Sinyaller**:
- Çoğu trend takip eden gösterge gibi, hızlı fiyat hareketlerinde gecikme yaşanabilir.
---
### **SuperTrend'i Ticarette Nasıl Kullanılır?**
1. **Göstergeyi Grafiğinize Ekleyin**:
- SuperTrend göstergesini grafiğinize ekleyin.
- ATR periyodunu ve çarpanı tercihinize göre ayarlayın.
2. **Alış Sinyalleri**:
- Fiyat SuperTrend çizgisini yukarı kestiğinde ve çizgi yeşile döndüğünde, bu bir alış sinyalidir.
- Stop-loss'u SuperTrend çizgisinin altına yerleştirin.
3. **Satış Sinyalleri**:
- Fiyat SuperTrend çizgisini aşağı kestiğinde ve çizgi kırmızıya döndüğünde, bu bir satış sinyalidir.
- Stop-loss'u SuperTrend çizgisinin üstüne yerleştirin.
4. **İşlem Yönetimi**:
- İşlemlerden çıkmak için SuperTrend çizgisini rehber olarak kullanın.
- Gösterge yön değiştirdiğinde işlemi kapatın.
---
### **Performansı Artırmak İçin İpuçları**
1. **Diğer Araçlarla Birleştirin**:
- Sinyalleri doğrulamak için SuperTrend'i **Hareketli Ortalamalar** veya **RSI** gibi diğer göstergelerle birleştirin.
2. **Zaman Dilimine Göre Ayarlayın**:
- Günlük ve daha kısa zaman dilimleri için farklı ayarlar kullanın.
3. **Risk Yönetimi**:
- Zararları minimize etmek için her zaman stop-loss ve kar al seviyeleri kullanın.
---
### **Sonuç**
SuperTrend stratejisi, trendleri belirlemek ve net ticaret sinyalleri üretmek için güçlü ve etkili bir araçtır. Ancak, dikkatli kullanılmalı ve doğruluğu artırmak için diğer araçlarla birleştirilmelidir. Bu strateji, güçlü trendli piyasalarda işlem yapmayı tercih eden yatırımcılar için idealdir.