

BollingerRsiCombinedBot_noSourceCode
cBot
バージョン 1.0、Sep 2025
Windows、Mac, Mobile, Web
登録日 07/08/2024
5
販売
3.24K
無料インストール
説明
概要
この戦略は、2つの人気のあるテクニカル指標を組み合わせて、高確率の取引機会を特定します:
- ボリンジャーバンドは価格の極端な動きと潜在的な反転ゾーンを検出するために使用されます。価格が上部または下部のバンドに触れたときに取引が開始されます。
- 相対力指数(RSI)は、市場の勢いを測定してこれらのシグナルをフィルタリングします。RSIが売られ過ぎゾーンにある場合のみロング取引が行われ、RSIが買われ過ぎの場合はショート取引が行われます。
トレンドとモメンタム分析を組み合わせることで、ロボットはエントリーのタイミングを改善し、誤ったシグナルを減らすことを目指しています。
主要設定
すべてのパラメータはcBotの設定画面で完全にカスタマイズ可能です:
- 取引量(ロット数) – ポジションサイズ。デフォルト:0.01ロット。
- ストップロス / テイクプロフィット(ピップス) – 初期のリスクとリワードレベル。デフォルト:15ピップスSL、30ピップスTP。
- RSI期間 – RSIの計算期間(デフォルト:14)。
- RSIの買われ過ぎ / 売られ過ぎレベル – ショート/ロング設定をトリガーする閾値(デフォルト:70と30)。
- ボリンジャー期間 – バンドを計算するために使用されるバーの数(デフォルト:20)。
- ボリンジャー標準偏差 – バンド幅(デフォルト:2.0)。
これらの入力値は、異なるシンボルや時間枠に合わせて調整できます。
重要な注意事項
これはシンプルで実験的な戦略であり、複数の指標をcBotで組み合わせる方法を示すために設計されています。金融アドバイスを意図したものではなく、利益を保証するものではありません。自己責任で使用し、ライブ運用前に必ずデモ口座でテストしてください。
バックテストのハイライト
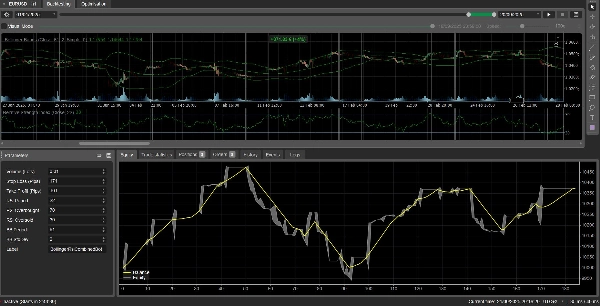
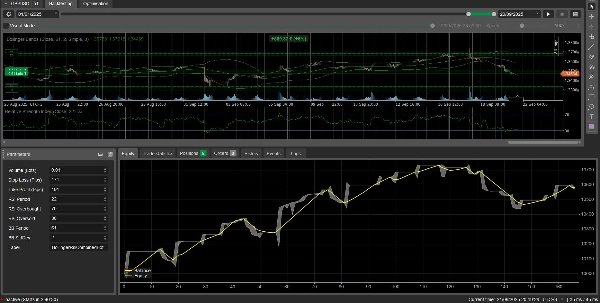
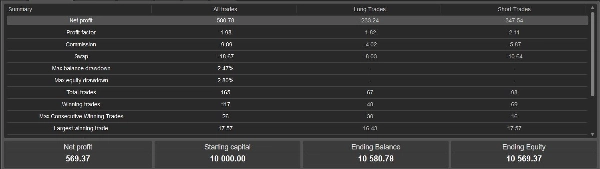
最近のEURUSDの過去データ(H1タイムフレーム)でのデフォルト設定によるテストでは、ボットは以下の結果を出しました(添付のスクリーンショット参照):
- 純利益: $580.78(開始残高 $10,000)
- 利益率: 1.98
- 総取引数: 165、うち117が勝ち取引
- 最大残高ドローダウン: 2.47 %
- 最大勝ち取引: $17.57
- 最終資本: $10,569.37
これらの数値は説明目的のみであり、過去のパフォーマンスが将来の結果を保証するものではありません。
概要
AI summary
This trading bot combines Bollinger Bands and the Relative Strength Index (RSI) to identify high-probability trading opportunities. It opens trades when the price touches the upper or lower Bollinger Band, signaling potential price extremes or reversal zones. The RSI is used to filter these signals by market momentum: long trades occur when RSI indicates oversold conditions, and short trades when RSI shows overbought levels. This combination aims to enhance entry timing and reduce false signals.
Key customizable settings include position volume, stop loss and take profit levels, RSI calculation period and threshold levels, as well as Bollinger Bands’ period and standard deviation. These parameters can be adjusted to fit different symbols and timeframes.
Backtesting on EURUSD (H1 timeframe) with default settings showed a net profit of $580.78 from a $10,000 starting balance, a profit factor of 1.98, and a maximum drawdown of 2.47%. The bot executed 165 trades, with 117 winners.
This strategy serves as a simple, experimental example of combining multiple indicators in automated trading. It is intended for demonstration purposes and should be tested on demo accounts before live use.
Key customizable settings include position volume, stop loss and take profit levels, RSI calculation period and threshold levels, as well as Bollinger Bands’ period and standard deviation. These parameters can be adjusted to fit different symbols and timeframes.
Backtesting on EURUSD (H1 timeframe) with default settings showed a net profit of $580.78 from a $10,000 starting balance, a profit factor of 1.98, and a maximum drawdown of 2.47%. The bot executed 165 trades, with 117 winners.
This strategy serves as a simple, experimental example of combining multiple indicators in automated trading. It is intended for demonstration purposes and should be tested on demo accounts before live use.
取引プロフィール
カスタマーレビュー
0.0
レビュー: 0
カスタマーレビュー
この商品にはまだレビューがありません。お使いになったことがある方は、ぜひレビューをお願いします。
ディスカッション
よくあるご質問
Forex
Signal
RSI
Bollinger
cTrader Storeで入手可能な取引ボット、インジケーター、プラグインなどの商品は、第三者の開発者が提供するものであり、情報と技術の取得のみを目的としてご利用いただけます。cTrader Storeはブローカーではなく、投資助言や個人的な推奨を行うことも、将来のパフォーマンスを保証することもありません。
これも好きかも














価格
登録日 07/08/2024
5
販売
3.24K
無料インストール