

说明
它关注的内容
这不是基于影线或收盘价绘制的。对于每根K线,它使用滚动的5根K线窗口构建真实的成交量分布,将价格区间分成200个桶,并找到实际成交量最大的地方——这就是它工作的水平。然后它使用两种回溯速度扫描该序列的波峰和波谷:一种是针对最近枢轴点的快速速度,另一种是针对更稳定枢轴点的较慢且更宽的速度。
如何阅读
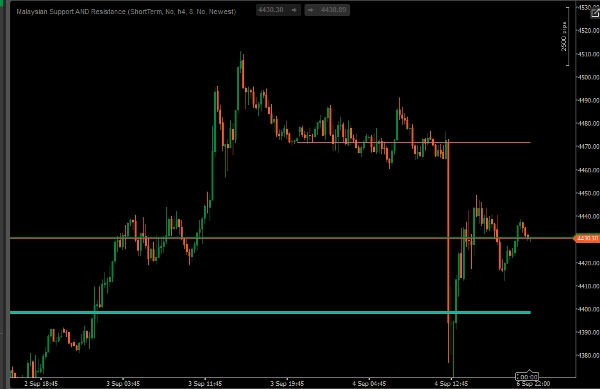
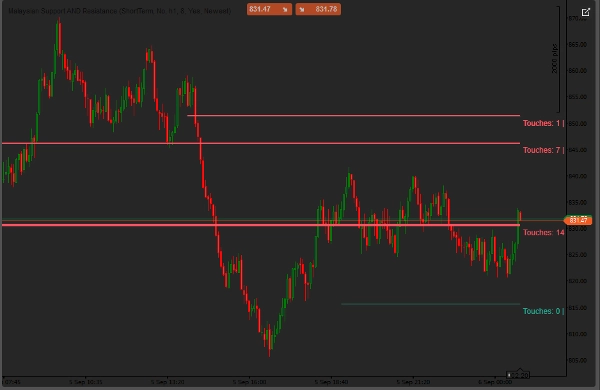
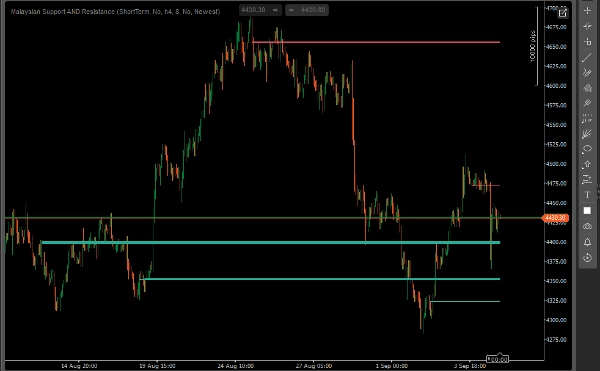
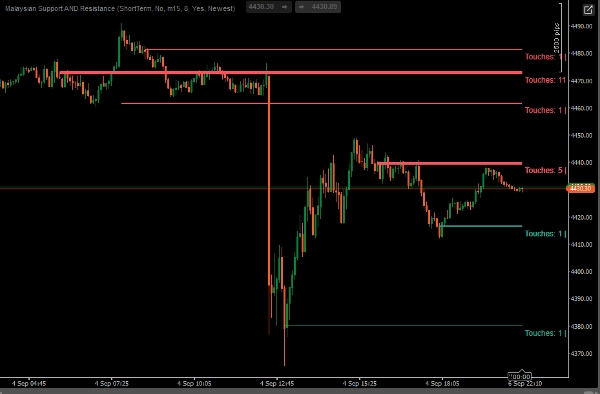
每条线都是一个支撑或阻力位。颜色显示当前价格是在其上方(支撑)还是下方(阻力)。线条的粗细表示其重要性——价格触及的次数以及附近成交的成交量。开启“显示触及 | 成交量计数”并悬停在线上即可查看具体数字。您最多会看到8个水平:最新快速形成的高点/低点,加上3个更稳定的高点和3个更稳定的低点。
关键设置
- 市场视角 — 短期 / 标准 / 长期,控制回溯枢轴点的时间范围
- 使用图表时间框架或特定的更高时间框架
- 显示线条数量 — 1 到 8 条
- 选择水平依据 — 最新(最近的3个)或最强(触及次数最多/成交量最高的3个,不论时间先后)
- 显示触及 | 成交量计数 — 在每条线上添加数字
- 支撑/阻力颜色 — 完全可自定义
适用对象
适合使用价格行为、SMC或ICT风格概念的交易者,他们希望获得客观的支撑/阻力位,而不是手工绘制。作为与您自身结构和流动性解读的汇合层效果最佳,而非独立信号。
值得了解
- 水平只有在经过足够的K线验证后才确认——近期价格不会移动已确认的水平
- 成交量为成交笔数量,适用于外汇/差价合约/合成品种——非交易所成交量
- 需要一定的历史数据支持。在新上市或交易清淡的品种上,起初可能看到少于8个水平,随着更多枢轴点确认,水平会逐渐补全
摘要
AI summary
Malaysian Support AND Resistance is a trading indicator that identifies key support and resistance levels using a rolling volume profile. It analyzes every bar by constructing a volume profile over a rolling 5-bar window, dividing the price range into 200 buckets to locate price levels with the highest traded volume. The indicator detects swing highs and lows with two lookback speeds—fast for recent pivots and slower for more established levels.
Displayed lines represent support or resistance, with color indicating whether the current price is above (support) or below (resistance) the level. Line thickness reflects importance based on the frequency of price touches and volume traded near the level. Users can view up to eight levels simultaneously, including the newest fast-forming pivots and multiple established highs and lows. Additional features include customizable settings for market view (short to long term), timeframe selection, number of lines shown, level selection criteria (newest or strongest), and display of touch and volume counts.
This indicator is designed for traders employing price action, Smart Money Concepts (SMC), or ICT-style methods who prefer objective support and resistance levels derived from volume data rather than manual drawing. It functions best as a complementary tool alongside other structural and liquidity analyses. The volume data used is tick volume, standard for forex, CFDs, and synthetic instruments.
Displayed lines represent support or resistance, with color indicating whether the current price is above (support) or below (resistance) the level. Line thickness reflects importance based on the frequency of price touches and volume traded near the level. Users can view up to eight levels simultaneously, including the newest fast-forming pivots and multiple established highs and lows. Additional features include customizable settings for market view (short to long term), timeframe selection, number of lines shown, level selection criteria (newest or strongest), and display of touch and volume counts.
This indicator is designed for traders employing price action, Smart Money Concepts (SMC), or ICT-style methods who prefer objective support and resistance levels derived from volume data rather than manual drawing. It functions best as a complementary tool alongside other structural and liquidity analyses. The volume data used is tick volume, standard for forex, CFDs, and synthetic instruments.
指标配置
指标分类
支撑与阻力
输出类型
可视化
数据要求
交易量
跳动点数据
支持的信号
触及水平位
客户评价
0.0
评价:0
客户评价
该产品尚无评价。已经试过了?抢先告诉其他人!
讨论
常见问答
Key Levels
Volume
Market Structure
Support & Resistance
cTrader Store 提供的所有产品,包括交易机器人、指标和插件,均由第三方开发者提供,仅供信息参考和技术访问之用。cTrader Store 并非经纪商,不提供投资建议、个人推荐或任何未来业绩保证。
该作者的其他作品


















价格
1
销售