Açıklama
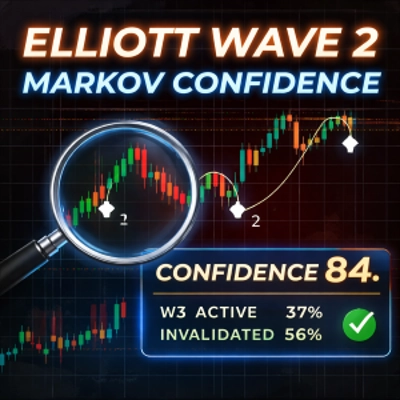
Elliott CLEAN — Wave2 + Markov Güveni
Elliott CLEAN, tüccarlara yardımcı olmak için tasarlanmış gelişmiş bir analitik göstergedir Elliott Dalga 2 kurulumlarını tanımlamak, doğrulamak ve yönetmek için piyasa yapısı ve istatistiksel olasılık kombinasyonunu kullanarak.
Fiyat yönünü tahmin etmek yerine, gösterge yapısal geçişlere odaklanır ve daha faydalı bir soruyu yanıtlar:
Bir Dalga 2'nin geçerli ve sürdürülebilir bir Dalga 3'e dönüşme olasılığı nedir — ve tüccar bu senaryoya ne kadar güvenmelidir?
Bu Gösterge Ne Yapar
Elliott CLEAN otomatik olarak:
- Salınım dönüm noktalarına dayalı Dalga 1–Dalga 2 yapılarını algılar
- Tanımlar tetikleyici, stop-loss, geçersiz kılma ve Dalga 3 hedefleri
- Tarihsel yapısal sonuçları takip eder ve 5 durumlu Markov modeli kullanır
- Şartlı olasılıkları hesaplar:
-
- Dalga 3 aktivasyonu
- Kurulumun geçersiz kılınması
- Erken Dalga 3 tükenmesi
- Bu olasılıkları tek bir Güven Skoru (0–100) haline dönüştürür
Bu, tüccarların düşük kaliteli kurulumları filtrelemesine, aşırı işlemden kaçınmasına ve sadece yapı ve istatistikler uyduğunda işlemi başlatmasına olanak tanır.
Temel Özellikler
- ✅ Otomatik Elliott Dalga 2 tespiti
- ✅ Birden fazla onay modu (Break+Hold, Break, Reclaim, Wick)
- ✅ Net tetikleyici, stop-loss, geçersiz kılma ve projeksiyon hedefleri
- ✅ 5 durumlu Markov olasılık motoru (olay/salınım bazlı, bar bazlı değil)
- ✅ Gerçek zamanlı şartlı olasılıklar grafik üzerinde gösterilir
- ✅ Karar desteği için tek bir Güven Skoru (0–100)
- ✅ Temiz, müdahaleci olmayan HUD tasarımı
- ✅ Her sembol ve zaman diliminde çalışır
Güven Skoru (Önemli)
Güven Skoru bir kazanma oranı değildir ve bir sinyal değildir.
Tarihsel yapısal geçişlerden türetilen bağlamsal bir kalite ölçütüdür:
- Dalga 2 sırasında, skor şunları yansıtır:
-
- Dalga 3'ün başlaması olasılığı
- Erken başarısızlık olasılığı ile ayarlanmış
- Dalga 3 sırasında, skor şunları yansıtır:
-
- Dalga 3'ün erken tükenme olmadan devam etme tarihsel olasılığı
Pratikte:
- Düşük skorlar = yapı zayıf veya güvenilmez
- Yüksek skorlar = yapı nadir ama istatistiksel olarak sağlam
Bu, tüccarların ne zaman temkinli kalacaklarına ve ne zaman işlemi sürdüreceklerine karar vermelerine yardımcı olur.
Tipik Kullanım Durumları
- ✔ Giriş öncesi Elliott Dalga kurulumlarını filtreleme
- ✔ Marjinal veya düşük kaliteli Dalga 2 işlemlerinden kaçınma
- ✔ Güvene dayalı pozisyon büyüklüğünü ayarlama
- ✔ Daha az duygusal müdahale ile Dalga 3 işlemlerini yönetme
- ✔ Nesnel yapı verileri ile takdirî ticareti destekleme
Gösterge, Elliott Dalga teorisini zaten anlayan ve otomasyon olmadan nicel onay isteyen tüccarlar için özellikle faydalıdır.
Nasıl Kullanılır (Temel İş Akışı)
- Göstergeyi bir grafiğe ekleyin
- Tercih ettiğiniz onay modunu seçin
- Geçerli bir Dalga 2 yapısı bekleyin
- Şunları gözlemleyin:
-
- Tetikleyici, stop-loss, geçersiz kılma
- Markov olasılıkları
- Güven Skoru
- Kurulumun işlem yapmaya değer olup olmadığına yapı + güven göre karar verin
Önemli Notlar ve Feragatname
- Bu gösterge analitik, tahmine dayalı değildir
- Alım/satım sinyalleri üretmez
- Geçmiş yapısal istatistikler gelecekteki sonuçları garanti etmez
- Ticaret risk içerir; kullanıcılar kararlarından tamamen sorumludur
Gösterge, takdirî tüccarlar için karar destek aracı olarak tasarlanmıştır.
Bu Gösterge Kimler İçin
- Elliott Dalga kavramlarına aşina tüccarlar
- Göstergelerden çok yapıya değer veren takdirî tüccarlar
- Otomatik sistemler değil, nesnel filtreler arayan tüccarlar
- Geriye dönük etiketler değil, olasılık bağlamı isteyen kullanıcılar
_______________________
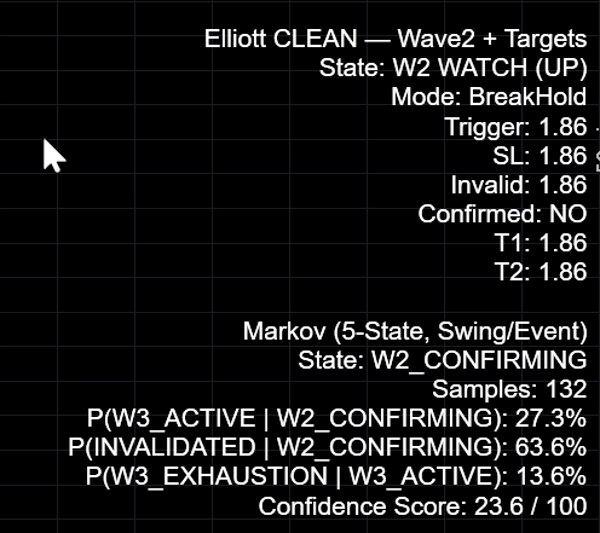
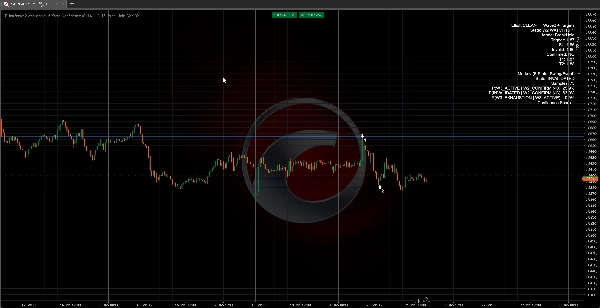
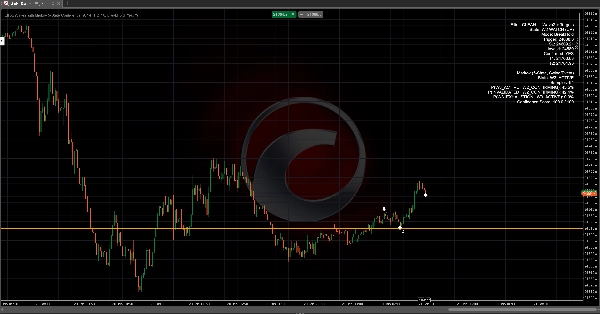
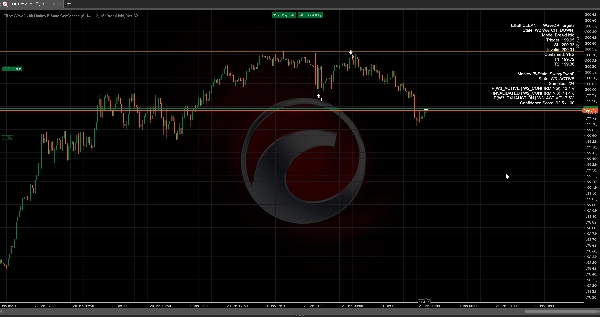
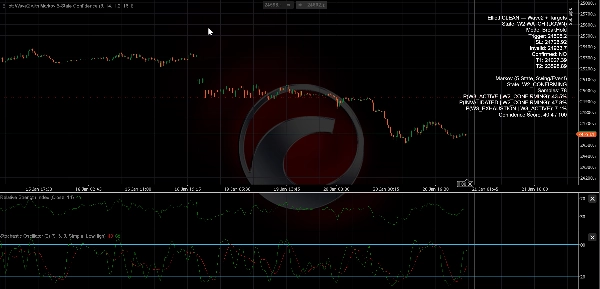
HUD ve Durumlar
Gösterge, yapı seviyelerini ve Markov olasılıklarını doğrudan grafikte gösterir.
Temel Elliott katmanı:
- Durum: W2 WATCH (YUKARI/AŞAĞI) — potansiyel Dalga 2 mevcut (yapı bulundu)
- Doğrulandı: EVET/HAYIR — seçilen onay kuralınız tetiklendi
- Tetikleyici — seviye fiyatı kırmalı/geri kazanmalı (moduna bağlı)
- SL — önerilen koruyucu stop seviyesi (SL moduna bağlı)
- Geçersiz — yapısal geçersiz kılma seviyesi (Dalga 1 başlangıcı)
- T1/T2 — çarpanlar kullanılarak Dalga 3 projeksiyonları
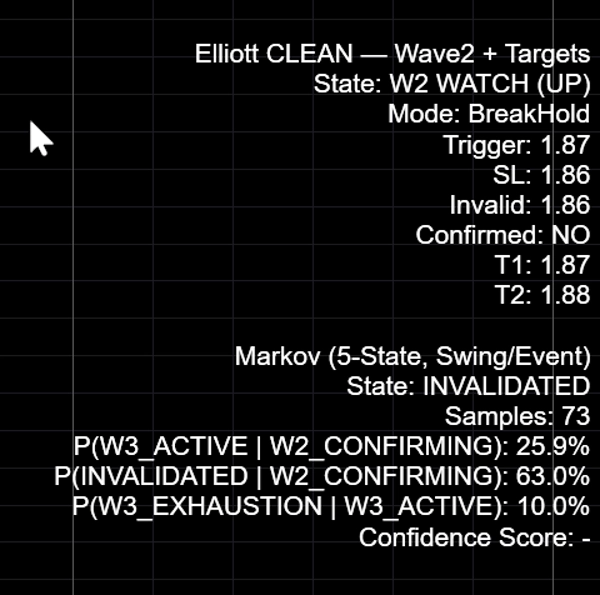
Markov katmanı:
- Durum — mevcut Markov durumu (örneğin,
W2_CONFIRMING,W3_ACTIVE,INVALIDATED) - Örnekler — olasılıklar için kullanılan tarihsel sayım
- P(W3_ACTIVE | W2_CONFIRMING) — Dalga 3'ün Dalga 2 aşamasından aktivasyon şansı
- P(INVALIDATED | W2_CONFIRMING) — Dalga 2 aşamasında kurulumun başarısız olma şansı
- P(W3_EXHAUSTION | W3_ACTIVE) — Dalga 3 aktif olduktan sonra erken başarısızlık şansı
Güven Skoru (0–100)
Güven Skoru bir kazanma oranı değildir ve garanti değildir. Tarihsel yapısal geçişlerden türetilmiş bir kalite ölçütüdür.
Skorun kullanımı:
- W2_CONFIRMING sırasında, skor “aktivasyon olasılığını” erken başarısızlık riski ile ayarlanmış olarak yansıtır.
- W3_ACTIVE sırasında, skor “devamlılık sağlamlığını” (düşük erken tükenme riski) yansıtır.
Skoru her zaman şu faktörlerle birlikte yorumlayın: (1) yapı netliği, (2) geçersiz kılma mesafesi ve (3) örnek büyüklüğü.
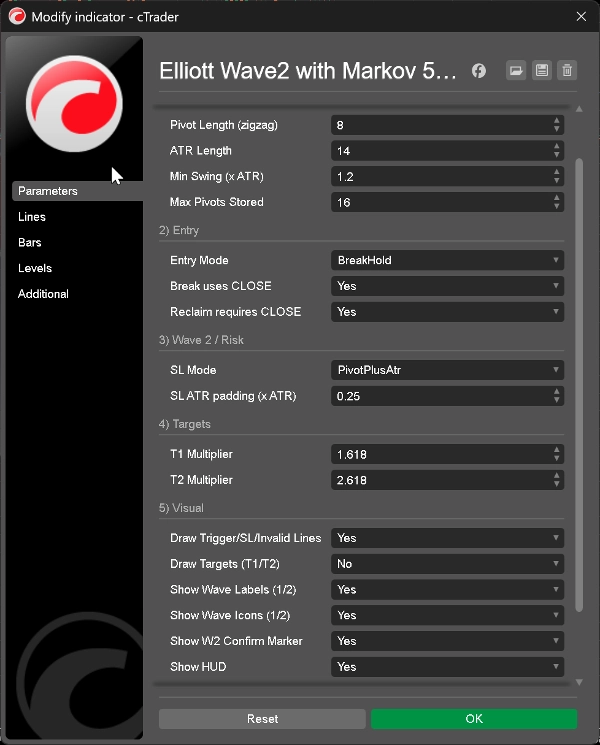
Girdiler (Ne işe yararlar)
1) Dönüm Noktası / Yapı
- Dönüm Noktası Uzunluğu (zigzag): Salınım hassasiyetini kontrol eder. Yüksek = daha az salınım, daha temiz yapı.
- ATR Uzunluğu: Salınım filtreleme ve isteğe bağlı SL yastığı için kullanılan ATR penceresi.
- Min Salınım (×ATR): Bir dönüm noktasını kabul etmek için minimum salınım büyüklüğü (gürültüyü filtreler).
- Maksimum Saklanan Dönüm Noktası: Saklanan salınım geçmişini sınırlar (performans ve stabilite).
2) Giriş
- Giriş Modu: Onay stilini seçin:
-
BreakHold— daha güvenli: tetikleyiciyi kır ve sonra tutBreak— daha hızlı: tetikleyiciyi bir kez kırReclaim— süpürme + geri kazanma davranışıWick— agresif: tetikleyiciyi fitil ile geç
- Break CLOSE kullanır: Kırma mantığı için fitil yerine kapanış kullanır (önerilir).
- Reclaim CLOSE gerektirir: Süpürme sonrası doğru tarafta kapanış gerektirir.
3) Dalga 2 / Risk
- SL Modu: Stop yerleştirme temelini belirler.
- SL ATR yastığı (×ATR): ATR tabanlı stop kullanırken ekstra tampon.
4) Hedefler
5) Görsel
- Tetikleyici/SL/Geçersiz Çizgilerini Çiz: Temel yatay seviyeleri göster/gizle.
- Hedefleri Çiz: İsteğe bağlı hedef çizgileri (daha az “temiz”).
- Dalga Etiketlerini / Simgelerini Göster: Dalga işaretçilerini göster (1/2).
- W2 Onay İşaretini Göster: Onay işaretini gösterir.
- HUD'u Göster: Tüm HUD'u göster/gizle.
Nasıl kullanılır:
- Birden fazla piyasayı tarayın, ardından sadece daha yüksek kaliteli yapısal ortamlara odaklanın.
- Kurulumun zaman ve risk açısından değerli olup olmadığına karar vermek için skor + örnek büyüklüğünü kullanın.
SSS
Bu tüm semboller ve zaman dilimlerinde çalışır mı?
Evet. Bu yapı tabanlı bir yaklaşımdır. Sonuçlar ve olasılıklar piyasa davranışı ve volatiliteye göre değişir.
Güven Skoru bir kazanma oranı mıdır?
Hayır. Tarihsel durum geçişlerinden türetilmiş yapısal bir kalite skorudur (Markov modeli). Sonuçları garanti etmez.
Dalga 2 sırasında skor neden genellikle düşüktür?
Çünkü Dalga 3 aktivasyonu seçicidir. Birçok Dalga 2 adayı başarısız olur veya dalgalanır. Gösterge bunları filtrelemek için tasarlanmıştır.
Düşük örnek büyüklüğü ne olacak?
Örnek büyüklüğü küçük olduğunda olasılıkları daha az stabil olarak değerlendirin. Skoru bağlam olarak kullanın, kesinlik olarak değil.
Risk Feragatnamesi
Ticaret risk içerir ve tüm yatırımcılar için uygun olmayabilir. Geçmiş performans ve tarihsel olasılık gelecekteki sonuçları garanti etmez. Bu gösterge yalnızca analitik bilgi sağlar ve herhangi bir enstrümanı alım veya satım için yatırım tavsiyesi veya önerisi oluşturmaz. Kararlarınız, risk yönetiminiz ve yerel düzenlemelere uyumunuz tamamen sizin sorumluluğunuzdadır.
Elliott Dalga, Piyasa Yapısı, Teknik Analiz, Olasılık, İstatistiksel Analiz, Salınım Ticareti, Risk Yönetimi, Karar Desteği
Özet
Müşteri değerlendirmeleri
5 | 100 % | |
4 | 0 % | |
3 | 0 % | |
2 | 0 % | |
1 | 0 % |


