
AllPattern
Indicador
362 descargas
Versión 1.0, Aug 2025
Windows, Mac
5.0
Valoraciones: 2
Descripción
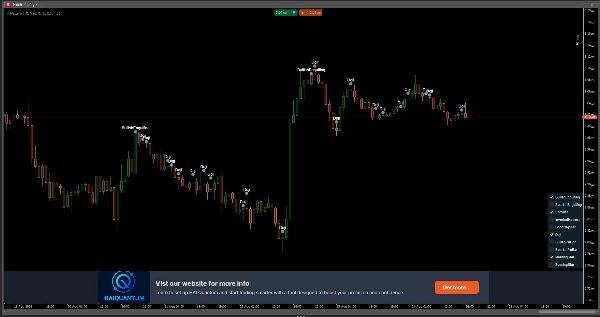
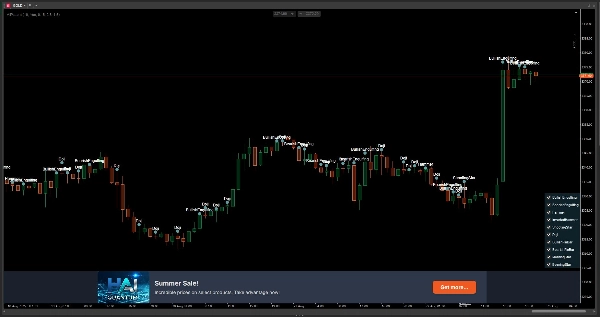
🔍 ¡Descubre todos los patrones de velas japonesas… absolutamente gratis! 😀
Con nuestra herramienta, puedes visualizar todos los principales patrones de velas directamente en tu gráfico. Desde Doji hasta Engulfing Alcista, incluyendo Martillo, Estrella Fugaz, y muchos más.
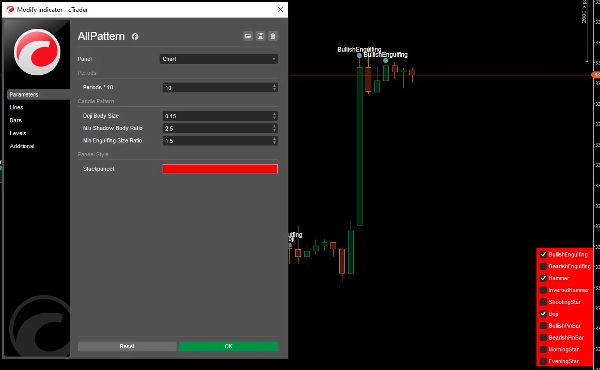
📌 ¿Cómo funciona? Es simple: usa el panel a la derecha para elegir exactamente qué patrones quieres mostrar. Actívalos o desactívalos para que coincidan con tu estrategia de trading.
💸 ¿La mejor parte? ¡Es completamente gratis! Sin suscripciones, sin límites—solo análisis visual puro.
Resumen
Perfil del indicador
Valoraciones de clientes
5.0
Valoraciones: 2
5 | 100 % | |
4 | 0 % | |
3 | 0 % | |
2 | 0 % | |
1 | 0 % |
Valoraciones de clientes
October 8, 2025
Chart artist’s dream! 🧠 Spots triangles, wedges, flags — all in one go. Saves tons of time on manual pattern drawing. Great helper, but always double-check those breakouts!
Conversación
Preguntas frecuentes
BTCUSD
Forex
Signal
Breakout
Indices
EURUSD
Commodities
GBPUSD
NZDUSD
Martingale
Prop
Scalping
Crypto
Grid
Stocks
AI
XAUUSD
NAS100
USDJPY
Los productos disponibles a través de cTrader Store, incluidos bots, indicadores y plugins para operar, son proporcionados por desarrolladores de terceros y están disponibles únicamente con fines informativos y de acceso técnico. cTrader Store no es un bróker, por lo que no proporciona asesoramiento de inversión, recomendaciones personales ni ninguna garantía de rentabilidad futura.


Precio
147
Ventas
11.17K
Instalaciones gratis