
Descripción
DÍA DE PRUEBA DEL OSCILADOR SUPER TREND 15
"ATENCIÓN," EN LAS VERSIONES DE PAGO TAMBIÉN ESTÁ DISPONIBLE UNA VERSIÓN DE PRUEBA GRATUITA DE 15 DÍAS" haga clic en el producto de pago y encontrará la versión gratuita-
Oscilador SuperTrend Simplificado - Descripción Completa
Resumen
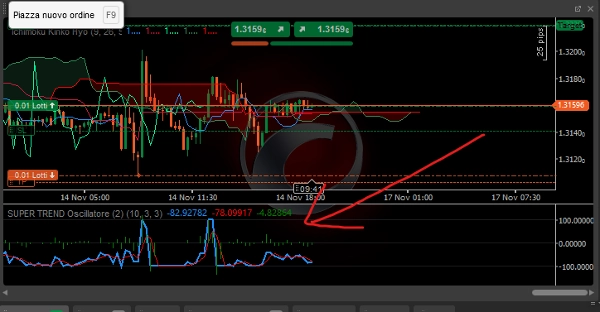
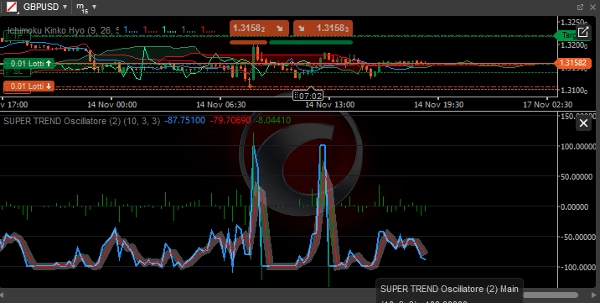
El Oscilador SuperTrend Simplificado es un indicador técnico avanzado para cTrader que transforma el clásico SuperTrend en un oscilador visual, facilitando la identificación de la dirección, fuerza y fiabilidad de la tendencia.
Componentes Principales
1. Línea Principal (Azul)
- Función: Muestra la distancia normalizada entre el precio y la línea SuperTrend
- Cálculo:
((Price - SuperTrend) / (ATR × Multiplier)) × 100 - Interpretación:
-
- > 0: Tendencia alcista (precio por encima de SuperTrend)
- < 0: Tendencia bajista (precio por debajo de SuperTrend)
- Rango: De -100 a +100
2. Línea de Señal (Roja)
- Función: Media móvil simple de la línea principal
- Periodo: Personalizable (por defecto 3 periodos)
- Uso: Filtra el ruido del mercado y confirma señales
3. Histograma (Gris)
- Función: Diferencia entre la línea principal y la línea de señal
- Interpretación:
-
- Positivo: Aceleración del impulso alcista
- Negativo: Aceleración del impulso bajista
- Cruce por cero: Potenciales reversiones de impulso
Parámetros Configurables
Parámetros SuperTrend:
- Periodo ATR: Periodo para el cálculo del Rango Verdadero Promedio (por defecto: 10)
- Multiplicador: Multiplicador para las bandas SuperTrend (por defecto: 3.0)
Parámetros del Oscilador:
- Periodo de Señal: Periodo para la línea de señal (por defecto: 3)
Interpretación de Señales
Condiciones de Tendencia:
- Tendencia Alcista Fuerte:
-
- Principal > +50
- Principal > Señal
- Histograma positivo
- Tendencia Bajista Fuerte:
-
- Principal < -50
- Principal < Señal
- Histograma negativo
- Mercado en Rango:
-
- Principal entre -30 y +30
- Cruces frecuentes de líneas
Señales de Trading:
Entrada Larga:
- La línea principal cruza por encima de 0
- El histograma se vuelve positivo
- La línea de señal confirma tendencia alcista
- Principal por encima de +20 para impulso
Entrada Corta:
- La línea principal cruza por debajo de 0
- El histograma se vuelve negativo
- La línea de señal confirma tendencia bajista
- Principal por debajo de -20 para impulso
Salida/Toma de Ganancias:
- Largo: Principal > +80 (sobrecompra) o cruce por debajo de Señal
- Corto: Principal < -80 (sobreventa) o cruce por encima de Señal
Ventajas de la Versión Simplificada
1. Rendimiento Optimizado
- Cálculos más eficientes
- Menor consumo de recursos
- Respuesta más rápida a cambios de precio
2. Facilidad de Uso
- Parámetros esenciales reducidos
- Señales visuales inmediatas
- Interpretación sencilla incluso para traders principiantes
3. Fiabilidad
- Menos susceptible al ruido
- Señales más claras y definidas
- Reducción de señales falsas en comparación con el SuperTrend clásico
Estrategias de Uso
Estrategia de Seguimiento de Tendencia:
- Entrada: Principal > 0 para largo, Principal < 0 para corto
- Filtro: Histograma con el mismo signo que Principal
- Salida: Reversión de signo o niveles extremos alcanzados
Estrategia de Momentum:
- Entrada: Principal > +30 (largo) o Principal < -30 (corto)
- Confirmación: Histograma acelerando
- Salida: Desaceleración del momentum (histograma decreciente)
Estrategia de Reversión a la Media:
- Entrada: Principal > +80 (corto) o Principal < -80 (largo)
- Confirmación: Reversión del histograma
- Salida: Retorno hacia la zona neutral
Condiciones Óptimas del Mercado
Mercados en Tendencia:
- Alta eficiencia
- Señales prolongadas
- Menos señales falsas
Mercados en Rango:
- Reducir tamaño de lote
- Extender el marco temporal
- Usar como filtro de momentum
Mejores Prácticas
Marcos Temporales Recomendados:
- Intradiario: M15 - H1
- Swing Trading: H4 - D1
- Trading de Posición: W1 - MN
Gestión de Riesgos:
- Stop Loss: 1.5-2 × ATR
- Take Profit: 2-3 × Riesgo
- Tamaño de Posición: 1-2% por operación
Confirmaciones Adicionales:
- Alineación en múltiples marcos temporales
- Confirmación de volumen
- Niveles clave de soporte/resistencia
Limitaciones
Consideraciones:
- Retardo inherente (indicador de seguimiento de tendencia)
- Rendimiento reducido en mercados en rango
- Necesidad de confirmaciones en baja volatilidad
Recomendaciones:
- Combinar con análisis de acción del precio
- Usar como filtro, no como sistema independiente
- Prueba en demo antes de uso en vivo
Este oscilador representa una herramienta poderosa para identificar tendencias fuertes y filtrar señales falsas manteniendo una simplicidad operativa adecuada tanto para traders principiantes como experimentados.
Resumen
Valoraciones de clientes
5 | 0 % | |
4 | 100 % | |
3 | 0 % | |
2 | 0 % | |
1 | 0 % |