
Institutional Volume Supply Demand
Indicador
1.51K descargas
Versión 1.0, Sep 2025
Windows, Mac
4.4
Valoraciones: 5
Descripción
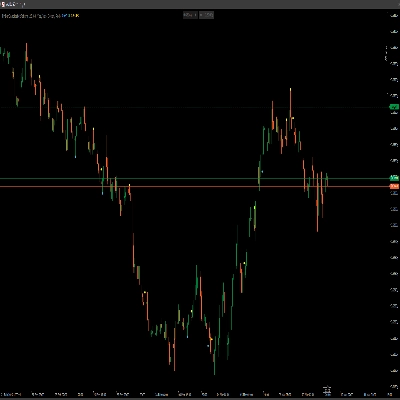
Zonas de Perfil de Volumen (Oferta/Demanda)
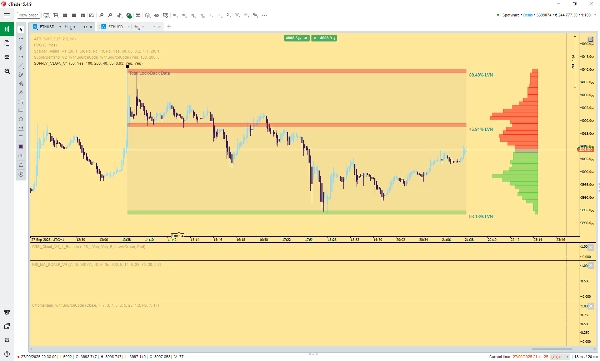
El indicador Zonas de Perfil de Volumen ofrece una vista de grado institucional de la estructura del mercado aprovechando el Volumen por Precio análisis. Identifica automáticamente niveles de Soporte y Resistencia de alta probabilidad basados en ineficiencias del mercado y vacíos de liquidez.
Características clave:
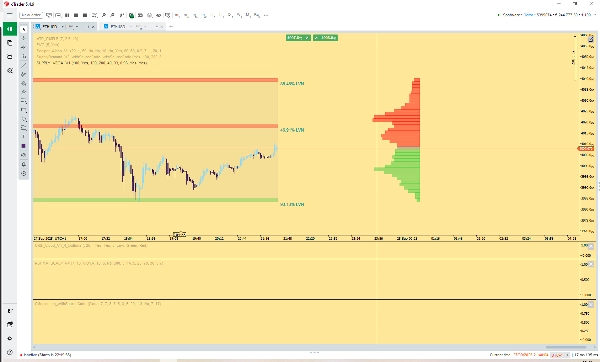
- S&R Institucional (LVNs): Calcula y marca automáticamente Nodos de Bajo Volumen (LVNs)—áreas donde el precio se movió rápidamente con un volumen de negociación mínimo. Estos LVNs actúan como zonas futuras de Oferta (Resistencia) y Demanda (Soporte) de alta convicción.
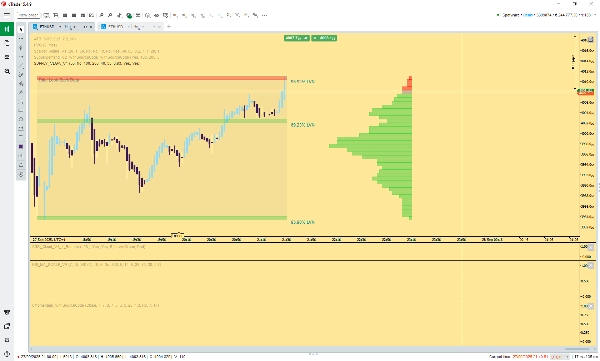
- Retroceso Dinámico: El perfil ajusta automáticamente su período de análisis para enfocarse solo en el movimiento o tendencia principal actual, reiniciándose después de un pivote significativo del mercado.
- Coloreado Relativo al Precio: El histograma visible del Perfil de Volumen y las zonas correspondientes de Oferta/Demanda se colorean dinámicamente según el precio actual:
-
- Verde: Áreas de volumen por debajo del precio actual (actuando como Demanda/Soporte).
- Rojo: Áreas de volumen por encima del precio actual (actuando como Oferta/Resistencia).
- Fuerza LVN: Las zonas están etiquetadas con un porcentaje que indica la debilidad del volumen en ese nivel, proporcionando una medida objetiva de la fuerza teórica de la zona (tamaño del vacío de liquidez).
Esta herramienta es esencial para los traders que utilizan técnicas avanzadas de estructura de mercado, flujo de órdenes o Perfil de Volumen para identificar puntos clave de interés y anticipar giros del mercado.
Resumen
Resumen de IA
The Institutional Volume Supply Demand indicator offers an advanced market structure analysis using Volume Profile Zones based on Volume at Price data. It automatically identifies key Support and Resistance levels by detecting Low Volume Nodes (LVNs), which represent areas where price moved rapidly with minimal trading volume, indicating potential future supply (resistance) and demand (support) zones. The indicator dynamically adjusts its look-back period to focus on the current major swing or trend, resetting after significant market pivots. It visually distinguishes supply and demand zones with color coding: green for volume areas below the current price (demand/support) and red for areas above (supply/resistance). Each LVN is labeled with a percentage that quantifies the weakness of volume at that level, providing an objective measure of zone strength based on liquidity void size. This tool supports traders employing advanced techniques such as order flow and Volume Profile analysis to identify high-probability market turning points. It is applicable across various markets including Forex pairs (e.g., EURUSD, GBPUSD, NZDUSD, USDJPY), cryptocurrencies (BTCUSD), indices (NAS100), and commodities (XAUUSD).
Perfil del indicador
Valoraciones de clientes
4.4
Valoraciones: 5
5 | 80 % | |
4 | 0 % | |
3 | 0 % | |
2 | 20 % | |
1 | 0 % |
Valoraciones de clientes
May 15, 2026
CTrader's recent update has made this indicator obsolete. It simply stops CTrader from working. this Indicator needs an update to correlate with the Ctrader update.
April 8, 2026
November 3, 2025
Excelente indicador para quem opera baseado em zonas de liquidez, oferta e demanda institucional. Ótimo trabalho!
Conversación
Preguntas frecuentes
BTCUSD
Forex
Signal
Breakout
EURUSD
GBPUSD
NZDUSD
Bollinger
Fibonacci
ZigZag
Scalping
Fair Value Gap
SMC
Grid
AI
XAUUSD
NAS100
MACD
USDJPY
VWAP
Los productos disponibles a través de cTrader Store, incluidos bots, indicadores y plugins para operar, son proporcionados por desarrolladores de terceros y están disponibles únicamente con fines informativos y de acceso técnico. cTrader Store no es un bróker, por lo que no proporciona asesoramiento de inversión, recomendaciones personales ni ninguna garantía de rentabilidad futura.


Precio
Desde 09/01/2025
11.78K
Instalaciones gratis