
Descrição
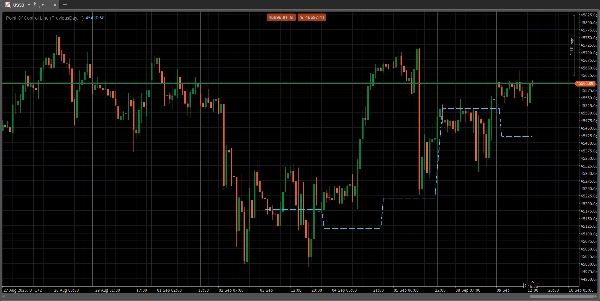
O Ponto de Controle (POC) é um nível de preço em um gráfico de perfil de volume onde o maior volume de negociação foi realizado dentro de um período especificado. Este nível atua como uma zona significativa de suporte ou resistência porque representa um preço onde grandes instituições de negociação foram mais ativas e onde o preço de mercado encontrou consenso. Os traders usam o POC para identificar zonas-chave de preço, avaliar o sentimento do mercado e antecipar potenciais movimentos e reversões de preço.
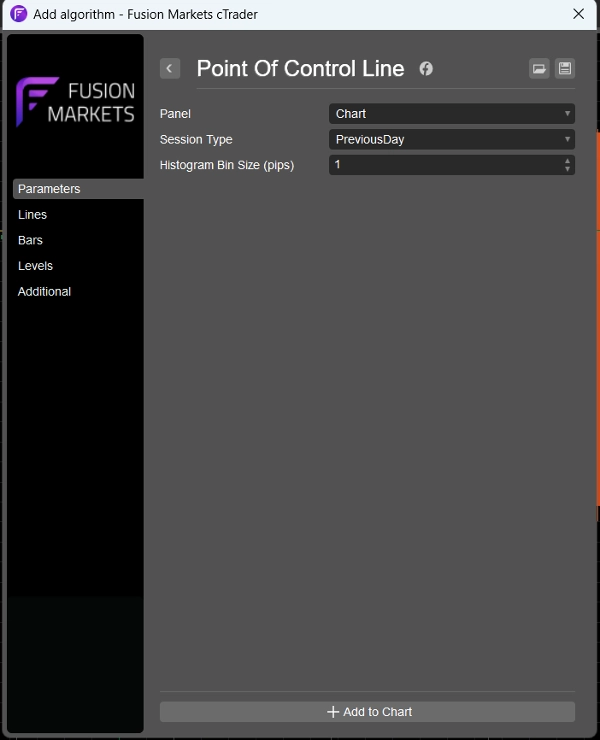
Eu removi todo o ruído dos indicadores usuais de perfil de volume, deixando apenas a linha do POC para aqueles que precisam apenas da linha. Incluí um parâmetro para visualizar a linha do POC para o dia anterior, perfil de volume de 4 horas ou 1 hora, tornando-o adequado para traders de diferentes prazos.
Resumo
Avaliações de clientes
5 | 100 % | |
4 | 0 % | |
3 | 0 % | |
2 | 0 % | |
1 | 0 % |


