
In - Market Field Manifold-MFM
مؤشر
الإصدار 1.0، Feb 2026
Windows, Mac
4.5
التقييمات: 4
منذ 03/01/2026
2
المبيعات
الوصف
ماذا يفعل مؤشر MFM v4.0؟
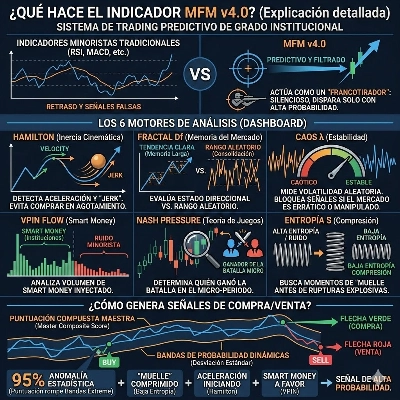
الMarket Field Manifold (MFM) v4.0 هو نظام تداول تنبؤي بمستوى مؤسسي. على عكس المؤشرات التقليدية للتجزئة (مثل RSI أو MACD) التي تتأخر عن طريق حساب المتوسطات الماضية، يطبق MFM الفيزياء والطوبولوجيا ونظرية المعلومات لـ التنبؤ بالشذوذات الوشيكة ويقوم بتصفية الانفصالات الكاذبة بشكل كبير.
يعمل مثل "قناص": يبقى صامتًا معظم الوقت ولا يرسم سهمًا إلا عندما تؤكد الرياضيات أن حركة سعرية انفجارية عالية الاحتمال قد بدأت للتو.
🧠 محركات التحليل الستة (ما تقرأه على لوحة التحكم)
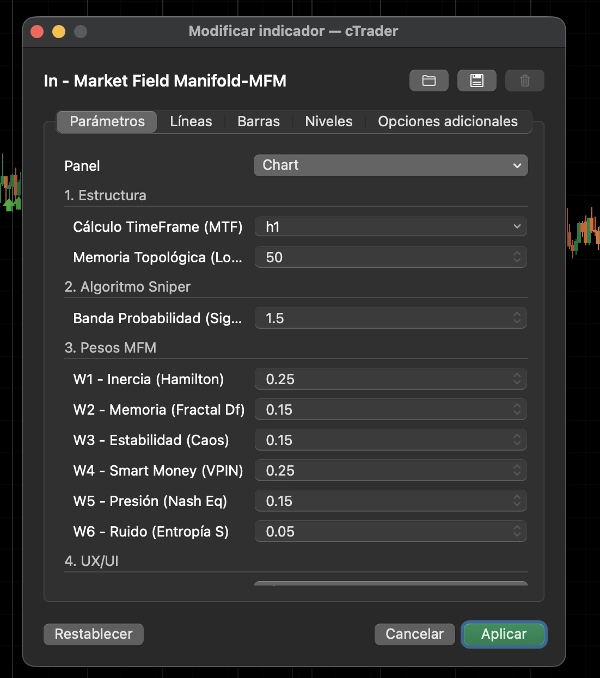
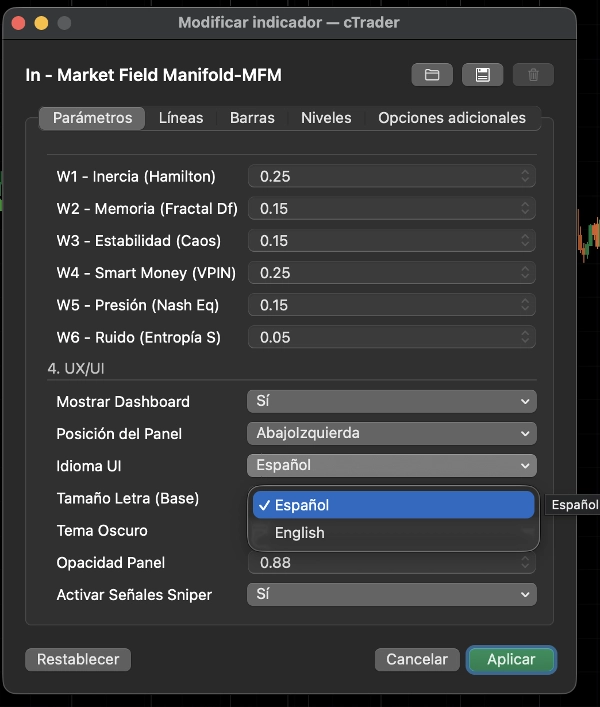
- هاملتون (القصور الذاتي الحركي): يقيس التسارع و"الاهتزاز" للسعر. يكتشف إذا كانت الحركة قد بدأت للتو بزخم عالي، مما يمنعك من الشراء عند القمة عندما تكون الحركة قد استُنفدت بالفعل.
- Fractal Df (ذاكرة السوق): يقيم ما إذا كان السوق في حالة اتجاهية واضحة (ذاكرة طويلة) أو يتقلب عشوائيًا في نطاق متقطع (توحيد).
- Chaos λ (الاستقرار): يقيس مستوى التقلب العشوائي. إذا كان السوق متقلبًا جدًا أو مُتلاعبًا به، يقوم MFM بوضع علامة "فوضوي" ويمنع أي إشارات تداول.
- VPIN Flow (المال الذكي): يحلل حجم التيك المتقاطع مع انتشار السعر لاكتشاف ما إذا كان المال الذكي (المؤسسات) يقوم فعليًا بضخ رأس المال، أو إذا كان مجرد ضوضاء تجزئة.
- Nash Pressure (نظرية الألعاب): ينظر إلى مكان إغلاق الشمعة بالنسبة لأعلى وأدنى سعر لتحديد من فاز نهائيًا بالمعركة (المشترون أو البائعون) في تلك الفترة الصغيرة.
- Entropy S (الضغط): يقيس اضطراب السوق. يبحث بشكل خاص عن لحظات "الزنبرك المضغوط" (انخفاض الإنتروبيا/انخفاض الضوضاء) لأن الانفصالات الأكثر انفجارية وربحية دائمًا ما تولد من توحيد هادئ.
🎯 كيف يولد إشارات الشراء/البيع؟
يحسب المؤشر درجة مركبة رئيسية. بدلاً من استخدام عتبة ثابتة لإعطائك دخولًا، ينشئ MFM أشرطة احتمالية ديناميكية (يحسب انحرافه المعياري المتحرك الخاص).
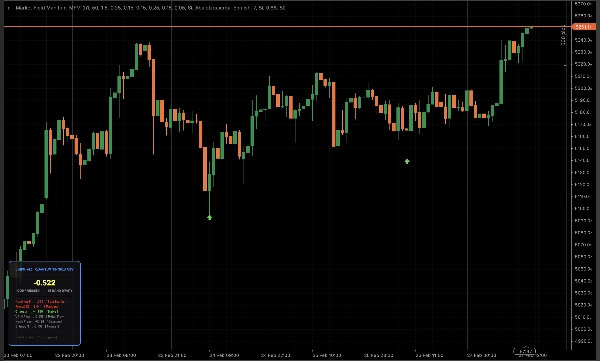
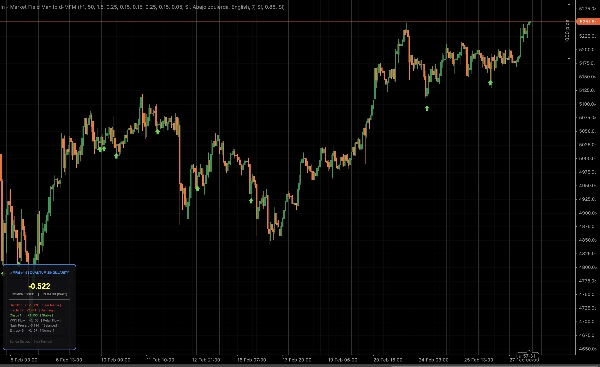
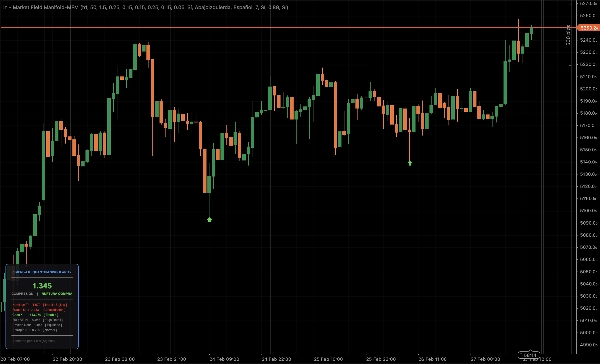
- لن ترى سوى سهم أخضر (شراء) أو سهم أحمر (بيع) عندما تكسر الدرجة هذه الأشرطة القصوى (شذوذ إحصائي بنسبة 95%)، يكون "الزنبرك" مضغوطًا، يبدأ التسارع للتو، والمال الذكي في صالحك.
الملخص
AI summary
The Market Field Manifold (MFM) v4.0 is an institutional-grade predictive trading indicator designed to forecast imminent market anomalies and filter out false breakouts. Unlike traditional lagging indicators, it applies principles from physics, topology, and information theory to identify high-probability explosive price moves. The indicator remains mostly silent, signaling only when a statistically significant move begins, marked by green (buy) or red (sell) arrows.
MFM v4.0 integrates six analytical engines displayed on its dashboard:
1. Hamilton (Kinematic Inertia): Detects acceleration and momentum onset to avoid late entries.
2. Fractal Df (Market Memory): Assesses market directionality versus consolidation.
3. Chaos λ (Stability): Measures market volatility and flags chaotic conditions to suppress signals.
4. VPIN Flow (Smart Money): Identifies institutional capital flow versus retail noise.
5. Nash Pressure (Game Theory): Determines buyer or seller dominance within micro-periods.
6. Entropy S (Compression): Detects low-noise consolidation phases that precede breakouts.
Buy and sell signals are generated when a composite score breaks dynamic probability bands, indicating a 95% statistical anomaly with favorable conditions including compressed price action, accelerating momentum, and smart money involvement. The indicator supports multiple markets including Forex, cryptocurrencies, stocks, indices, and commodities.
MFM v4.0 integrates six analytical engines displayed on its dashboard:
1. Hamilton (Kinematic Inertia): Detects acceleration and momentum onset to avoid late entries.
2. Fractal Df (Market Memory): Assesses market directionality versus consolidation.
3. Chaos λ (Stability): Measures market volatility and flags chaotic conditions to suppress signals.
4. VPIN Flow (Smart Money): Identifies institutional capital flow versus retail noise.
5. Nash Pressure (Game Theory): Determines buyer or seller dominance within micro-periods.
6. Entropy S (Compression): Detects low-noise consolidation phases that precede breakouts.
Buy and sell signals are generated when a composite score breaks dynamic probability bands, indicating a 95% statistical anomaly with favorable conditions including compressed price action, accelerating momentum, and smart money involvement. The indicator supports multiple markets including Forex, cryptocurrencies, stocks, indices, and commodities.
ملف تعريف المؤشر
تقييمات العملاء
4.5
التقييمات: 4
5 | 50 % | |
4 | 50 % | |
3 | 0 % | |
2 | 0 % | |
1 | 0 % |
تقييمات العملاء
March 11, 2026
on a cautious test, Starting small. 2 timeframes feels enough, and 3 percent DD would be my limit before changing settings. The weak spot shows up when risk stops matching the setup.
March 5, 2026
not some auto win thing, but it has a clear role. It helps with AI assisted trading, while the weak spot is that AI output still needs a manual filter. Better rechecked it on 30 days.
March 2, 2026
The first run should stay simple. For AI assisted trading, 114 setups on daily close is enough to see whether the tool deserves more attention.
March 1, 2026
Is easier to judge after expectations are normal. It can help with AI assisted trading, but the trader still needs to know why the entry makes sense. The useful comparison is hit rate versus average R.
مناقشة
الأسئلة الشائعة
BTCUSD
Forex
Signal
Indices
EURUSD
Commodities
GBPUSD
NZDUSD
Prop
Scalping
Crypto
Stocks
XAUUSD
NAS100
USDJPY
يتم توفير المنتجات المتاحة من خلال cTrader Store، بما في ذلك روبوتات التداول والمؤشرات والإضافات، من قبل مطوري الطرف الثالث وإتاحتها لأغراض الوصول المعلوماتي والفني فقط. cTrader Store ليس وسيطًا ولا يقدم نصائح استثمارية أو توصيات شخصية أو أي ضمان للأداء المستقبلي.
المزيد من هذا المؤلف









السعر
منذ 03/01/2026
2
المبيعات