
Описание
TIB — Индикатор Баров Дисбаланса Тиков. Определяйте рыночную информацию до движения цены
Версия 2.0
Используйте раздел комментариев для запроса дополнительной информации
Доступно видео сессия с руководством по настройке после покупки
Tick Imbalance Bars приносит институциональный уровень анализа микроструктуры рынка в cTrader. Основанный на революционных исследованиях Маркоса Лопеса де Прадо, подробно изложенных в его книге Advances in Financial Machine Learning, этот индикатор отбирает данные о цене не по времени или объему, а по поступлению информации.
Основная идея
Традиционные бары (временные, тиковые, объемные) отбирают данные равномерно, пропуская критические моменты, когда действуют информированные трейдеры. Tick Imbalance Bars решают эту проблему, обнаруживая, когда давление покупок или продаж превышает ожидаемые уровни — сигнализируя о присутствии информированных трейдеров и потенциальном движении цены до достижения рыночного равновесия.
Как это работает
Индикатор применяет правило тика для классификации каждой сделки как давление покупки (+1) или продажи (-1). Затем он накапливает эти знаковые тики до тех пор, пока кумулятивный дисбаланс (θT) не превысит динамический порог, рассчитанный с использованием экспоненциального скользящего среднего (EWMA). Этот ожидаемый порог адаптируется к рыночным условиям, анализируя историческую вероятность покупки против продажи. Когда порог превышен, создается новый бар TIB — каждый бар содержит примерно равное количество рыночной информации, независимо от объема или прошедшего времени.
Ключевые особенности
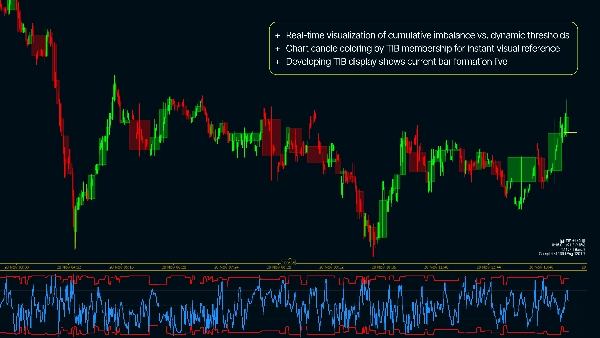
- Визуализация в реальном времени кумулятивного дисбаланса относительно динамических порогов
- Окраска свечей графика по принадлежности к TIB для мгновенного визуального восприятия
- Отображение формирующегося бара TIB в реальном времени
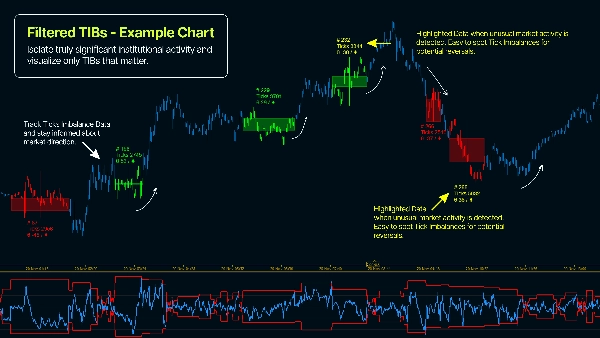
- Фильтр минимального количества тиков для отображения только статистически значимых баров
- Полностью настраиваемый ожидаемый размер бара и параметры EWMA
- Метрики панели управления для отслеживания интенсивности дисбаланса и плотности информации
Почему стоит использовать Tick Imbalance Bars?
- Частый отбор данных в периоды высокой информационной активности — захват значимой волатильности
- Обнаружение активности информированных трейдеров до достижения ценового равновесия
- Снижение шума от неинформированных участников рынка и розничного потока ордеров
- Лучшие статистические свойства (независимые и одинаково распределённые, похожие на гауссовы, доходности) по сравнению с временным отбором
- Применение проверенной методологии количественных финансов, используемой институциональными трейдерами
- Идентификация асимметричной информации в потоке ордеров — проверенный предиктор направления цены
Практическое руководство по базовой настройке ( ! )
- Применяйте индикатор на таймфрейме 1 минута (или ниже — используйте тиковые графики)
- E[T] - Введите ожидаемое количество тиков на бар для отбора (начинайте с 1000)
- EWMA Alpha - [0,001 - 0,5], где 0,001 даст наиболее стабильные результаты (теоретически), а 0,5 — TIB на основе более свежих данных
- Начальный дисбаланс - рекомендуется 0,5, но можно экспериментировать (0,5 = нейтральный дисбаланс при инициализации)
Сводка
The indicator classifies each trade as buying (+1) or selling (-1) pressure using the tick rule and accumulates these signed ticks until a dynamic threshold—calculated via an Exponentially Weighted Moving Average (EWMA)—is exceeded. When this threshold is breached, a new Tick Imbalance Bar (TIB) is formed, each containing roughly equal market information regardless of elapsed time or volume.
Key features include real-time visualization of cumulative imbalance versus dynamic thresholds, candle coloring by TIB membership, live display of the developing bar, a minimum ticks filter for statistical significance, configurable expected bar size and EWMA parameters, and dashboard metrics tracking imbalance intensity and information density.
This approach enables more frequent sampling during high-information periods, reduces noise from uninformed trades, and provides better statistical properties than time-based sampling. It supports markets including Forex, indices, and cryptocurrencies, and is suitable for strategies such as scalping and breakout trading.
Отзывы покупателей
5 | 100 % | |
4 | 0 % | |
3 | 0 % | |
2 | 0 % | |
1 | 0 % |


