
Mô tả
Order Block - Tín hiệu Cấu trúc Thị trường
Công cụ mạnh mẽ này, được phát triển bởi các nhà giao dịch chuyên nghiệp, đã chứng minh hiệu quả của nó trên các tài khoản giao dịch thực.
Ưu điểm chính:
- Đa năng: hoạt động trên bất kỳ công cụ, thị trường và khung thời gian nào (forex, crypto, cổ phiếu, trái phiếu, hợp đồng tương lai).
- Chính xác: cho kết quả tốt nhất trên biểu đồ tick, lọc ra các xung nhanh trong các chuyển động thị trường mạnh. Cũng hoạt động tốt trên các khung thời gian tiêu chuẩn.
- Linh hoạt trong cài đặt: cho phép bạn điều chỉnh chỉ báo phù hợp với phong cách và sở thích giao dịch của mình.
- Rõ ràng về mặt trực quan: hiển thị rõ ràng các mức phá vỡ cấu trúc thị trường, tín hiệu và vùng hỗ trợ/kháng cự (OrderBlock).
Chức năng chính:
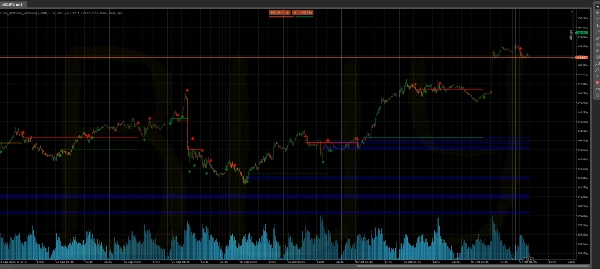
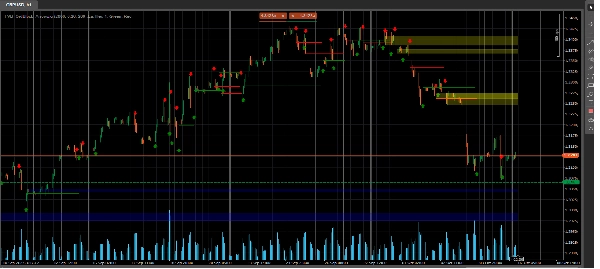
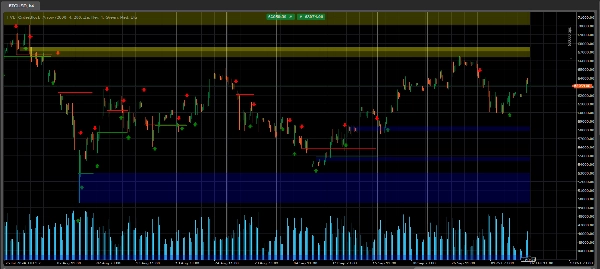
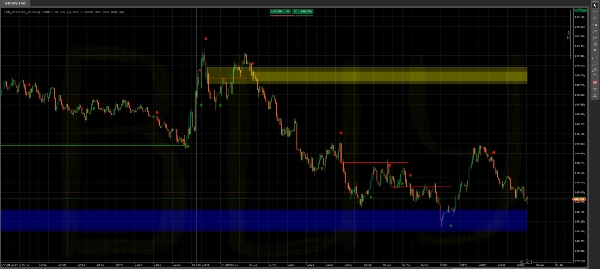
- Tính toán và hiển thị động các vùng OrderBlock
- Tín hiệu vào lệnh (mũi tên đỏ và xanh lá)
- Hiển thị xu hướng di chuyển tương lai có thể xảy ra (tùy chọn)
- Độ trong suốt của khối có thể điều chỉnh
- Tùy chọn để loại bỏ các vùng đã hoàn thành
Luôn xem xét bối cảnh thị trường!
Cài đặt:
Bars History - số lượng thanh để tính toán (nếu quá nhiều - có thể làm máy tính bị tải). Mặc định là 2000 thanh.
Deviation % Zigzag - tham số chính - tính toán từ zigzag. Điều chỉnh tùy theo khung thời gian và công cụ Block
Transparency 0-250 - độ trong suốt của các khối Delete Old/Broken Boxes - có xóa các khối cũ hay không
Delete Arrows - không hiển thị mũi tên tín hiệu Arrow Distance (ATR multiplier) - khoảng cách từ thanh đến mũi tên tính theo ATR ........
Delete Dots - tắt vẽ các chấm (chức năng gây tranh cãi - các chấm thể hiện xu hướng di chuyển tương lai có thể xảy ra)
Trên biểu đồ: Các đường đỏ và xanh lá - các mức phá vỡ cấu trúc thị trường Các mũi tên đỏ và xanh lá - tín hiệu chỉ báo Các dải - vùng OrderBlock - hỗ trợ và kháng cự. Chúng được tính toán động và bị loại bỏ khi hoàn thành (có tùy chọn giữ chúng trên biểu đồ)
Quan trọng: Mã chỉ báo được bảo vệ bởi bản quyền.
Tóm tắt
Đánh giá của khách hàng
5 | 50 % | |
4 | 0 % | |
3 | 50 % | |
2 | 0 % | |
1 | 0 % |


![Logo "[Stellar Strategies] Smart ADX"](https://cdn.ctrader.com/image/webp/af13b084-b6f6-41db-b7bc-c7e688b57b05_36929)


