الوصف
Bar Force هو مؤشر تحليل قوة الشمعة مصمم لمساعدة المتداولين على التعرف بسرعة على لحظات توسع التقلبات وزخم السوق.
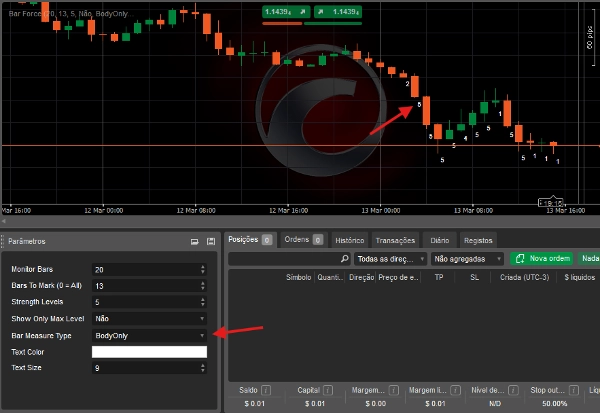
يقوم المؤشر بتصنيف كل شمعة تلقائيًا بناءً على قوتها النسبية مقارنة بالشموع السابقة، ويعرض قيمة رقمية مباشرة على الرسم البياني. هذا يجعل من السهل التعرف على الشموع الضعيفة أو المتوسطة أو القوية جدًا ضمن سياق السوق الحديث.
الالنسخة الكاملة توفر تحكمًا كاملاً في معايير التحليل، مما يسمح للمتداولين بتكييف المؤشر مع أسواق وأطر زمنية وأنماط تداول مختلفة.
الميزات الرئيسية
✔ تصنيف قوة الشمعة تلقائيًا
✔ يعتمد على تقلبات السوق الحديثة
✔ عرض مباشر على الرسم البياني لتحليل بصري سريع
✔ مثالي لـ تداول حركة السعر، الاختراق، والزخم
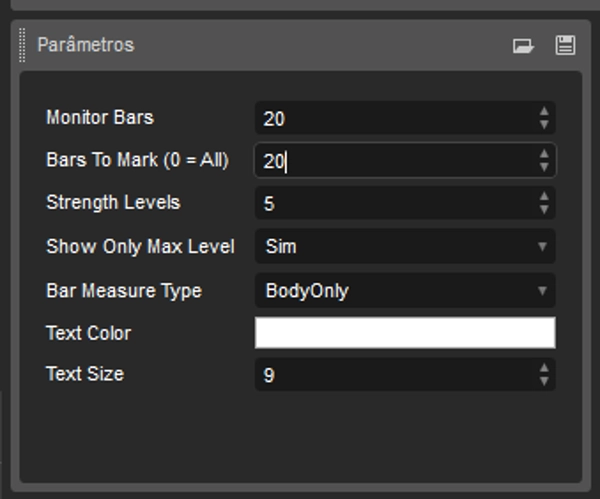
المعلمات القابلة للتكوين
توفر النسخة الكاملة تخصيصًا كاملاً.
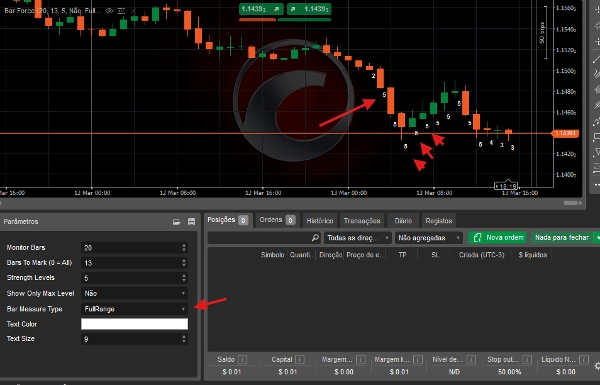
نوع قياس الشمعة
يمكن للمستخدمين اختيار كيفية حساب قوة كل شمعة:
- النطاق الكامل – يستخدم النطاق الكلي للشمعة (الأعلى – الأدنى)
- الجسم فقط – يستخدم فقط جسم الشمعة (الافتتاح – الإغلاق)
هذا يسمح باستخدام المؤشر لكل من تحليل التقلبات و تحليل القوة الاتجاهية.
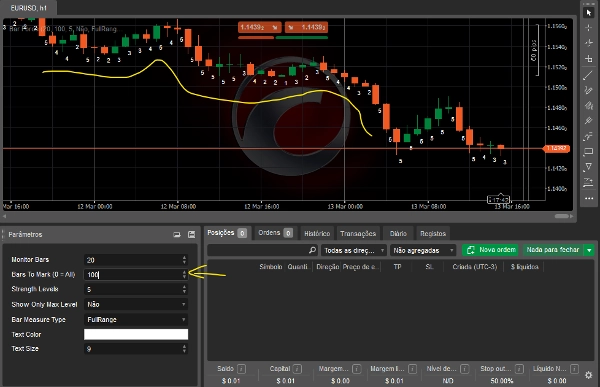
نطاق المراقبة
يحدد عدد الشموع السابقة المستخدمة لحساب متوسط قوة السوق.
أمثلة:
- 50 شمعة
- 100 شمعة
- 200 شمعة
هذا يسمح للمؤشر بالتكيف مع ظروف السوق المختلفة.
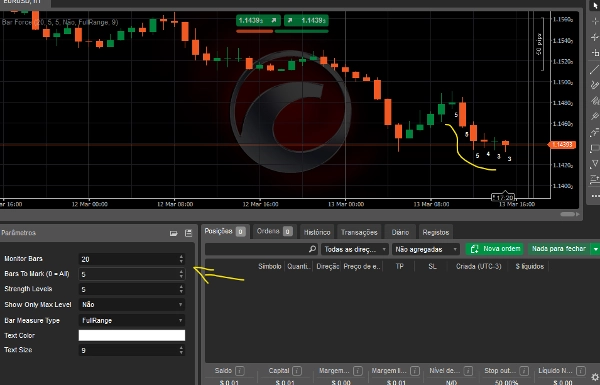
عدد الشموع المعروضة
يمكن للمتداولين اختيار عدد الشموع الحديثة التي ستعرض تصنيف القوة على الرسم البياني.
أمثلة:
- آخر 5 شموع
- آخر 20 شمعة
- أو التاريخ الكامل
مقياس القوة
يحدد عدد مستويات التصنيف المستخدمة.
أمثلة:
- مقياس من 1 إلى 3
- مقياس من 1 إلى 5
- أو نطاق مخصص
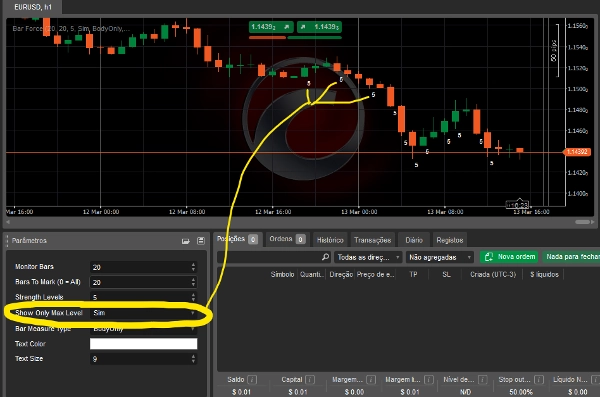
مرشح المستوى الأقصى
خيار لعرض الشموع التي تصل فقط إلى أقصى مستوى قوة، مما يسهل التعرف على أحداث الزخم القوي.
التخصيص البصري
يمكن للمستخدمين أيضًا ضبط:
- لون النص
- حجم النص
مما يسمح للمؤشر بالتوافق مع تخطيط الرسم البياني الخاص بهم.
لمن هذا المؤشر؟
- متداولو حركة السعر
- متداولو الاختراق
- المتداولون الذين يسعون للتعرف على الزخم وتوسع التقلبات
يقوم Bar Force بتحويل تحليل الشموع البصري إلى تصنيف قوة موضوعي، مما يساعد المتداولين على التعرف بسرعة على الفرص المحتملة في السوق.
الملخص
تقييمات العملاء
5 | 67 % | |
4 | 33 % | |
3 | 0 % | |
2 | 0 % | |
1 | 0 % |