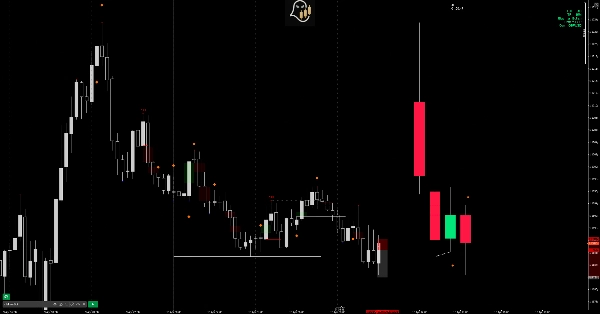
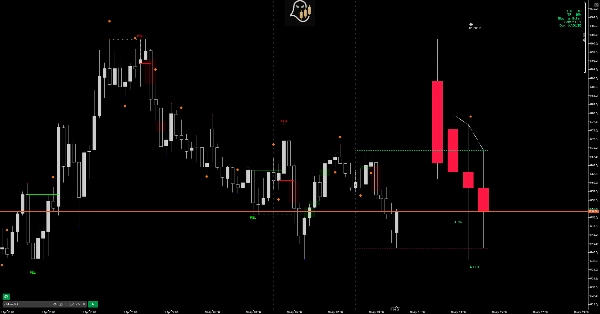
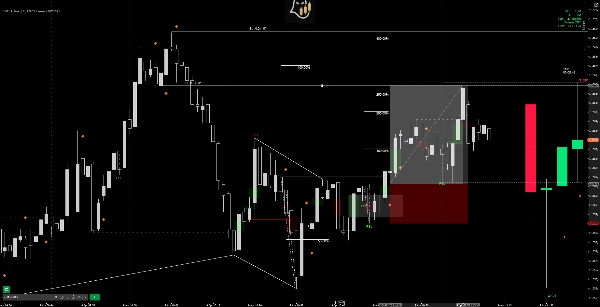
Penerangan
Melihat penunjuk penuh, izinkan saya menulis kedua deskripsi pendek dan senarai kedai penuh.
Deskripsi Pendek (120 aksara)
HTF Bias Detector: lilin panel, corak CRT/Expansion/Swing Point, penyimpangan PSP & SMT — semua dalam satu lapisan.
Deskripsi Kedai cTrader Penuh
HTF Bias Detector — Edisi Panel
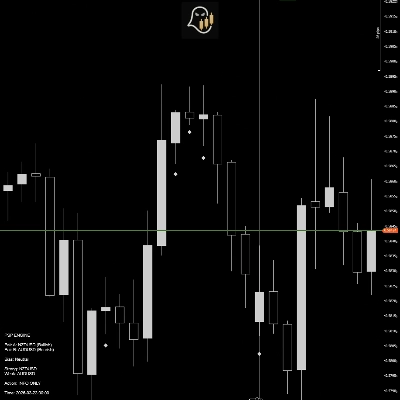
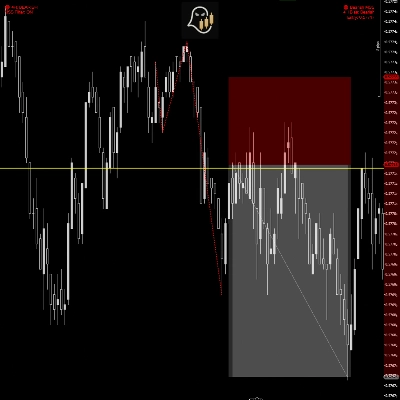
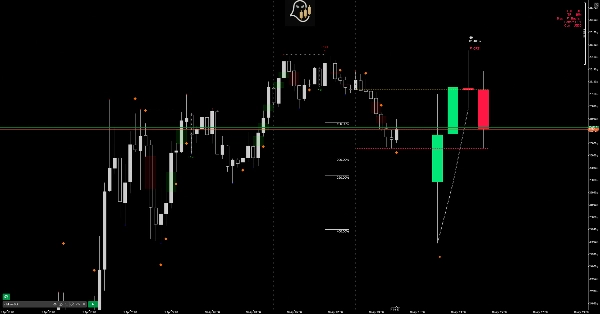
HTF Bias Detector membawa keseluruhan aliran kerja analisis atas ke bawah anda ke dalam satu penunjuk lapisan. Daripada bertukar antara jangka masa, ia melukis panel terapung lilin Jangka Masa Lebih Tinggi (HTF) terus di sebelah kanan harga pada carta semasa anda, kemudian secara automatik mengesan corak bias utama anda, penyimpangan pasangan berkorelasi, dan isyarat Teknik Wang Pintar — semua tanpa meninggalkan skrin.
Bagaimana Panel Berfungsi
Penunjuk secara automatik menentukan HTF yang betul berdasarkan carta yang anda gunakan, mengikuti penjajaran jangka masa standard yang digunakan dalam perdagangan institusi dan Wang Pintar:
Carta AndaPanel HTF
1M / 2M / 3M / 4M - 15M
5M / 10M - 1H
15M / 30M - 4H
1H - Harian
4H - Mingguan
Harian - Bulanan
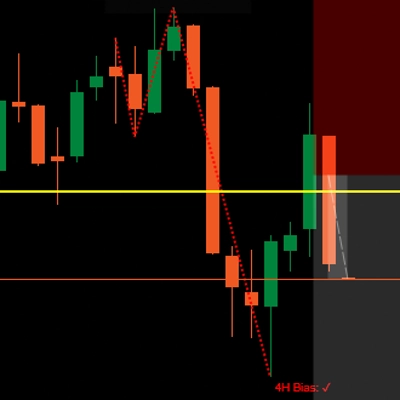
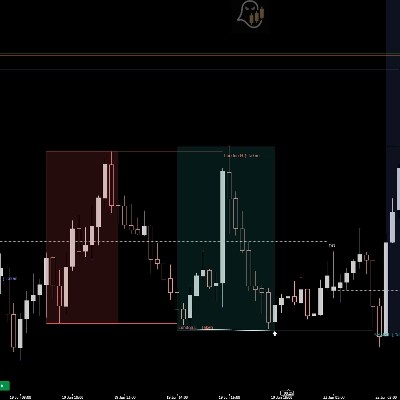
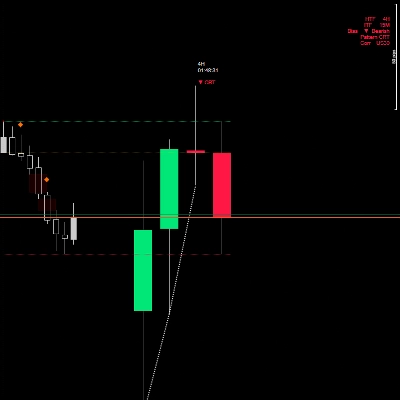
Panel melukis N lilin HTF yang boleh dikonfigurasikan (lalai 6) di sebelah kanan bar terakhir, lengkap dengan kotak latar belakang, sumbu yang berpusat pada setiap badan lilin, dan pemisah titik menegak pada carta langsung yang menandakan setiap pembukaan HTF. Pemasa undur di atas panel menunjukkan masa yang tinggal dalam lilin HTF semasa, dan garis unjuran OHLC putus-putus memanjang dari lilin HTF yang sedang terbentuk kembali ke kawasan harga langsung supaya anda sentiasa tahu di mana pembukaan, tinggi, rendah, dan tutup HTF semasa berada.
Pengesanan Corak Bias
Penunjuk mengimbas lilin panel HTF yang kelihatan untuk tiga corak bias institusi teras dan melabel setiap isyarat yang dikesan terus pada panel:
CRT — Teori Julat Lilin Dibentuk oleh dua lilin. C1 menetapkan julat. C2 menyapu rendah C1 (bullish) atau tinggi (bearish) tetapi menutup kembali di dalam julat tanpa mengambil ekstrem bertentangan. Menandakan tangkapan kecairan dan pengembangan ke arah bertentangan. C3 dan C4 adalah lilin pengembangan yang dijangka.
Pengembangan Dibentuk oleh dua lilin. C2 menyapu rendah C1 kemudian menutup di atas tinggi C1 (bullish), atau menyapu tinggi C1 kemudian menutup di bawah rendah C1 (bearish). Pengembangan julat penuh lilin tunggal yang menunjukkan tekanan arah yang luar biasa. C3 dan C4 adalah lilin sambungan yang dijangka.
Swing Point (Dilindungi) Dibentuk oleh tiga lilin. C1 menetapkan arah. C2 memecah dan menutup melebihi ekstrem C1 — memerangkap pedagang breakout. C3 sepenuhnya mengambil kembali julat C2 dengan menutup di atas pembukaan C2 (bullish) atau di bawah pembukaan C2 (bearish), melindungi ayunan dan menandakan pembalikan. C4 adalah sambungan yang dijangka.
Setiap corak yang dikesan dilabel dengan anak panah arah dan nama corak terus pada lilin isyarat dalam panel (contoh ▲ CRT, ▼ Pengembangan, ▲ Swing Point). Sistem peta warna memastikan apabila pelbagai corak bertindih pada lilin yang sama, corak terbaru sentiasa menang — mengelakkan warna lama dari isyarat terdahulu mencemari yang baru.
PSP — Titik Ayunan Ketepatan
PSP dikesan pada dua tahap serentak:
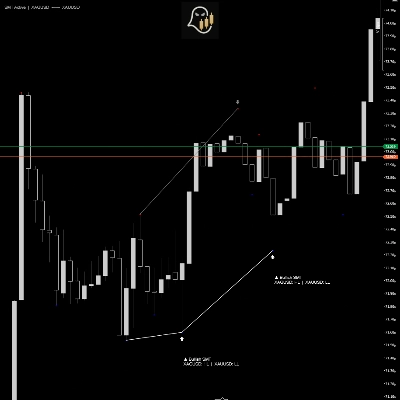
Panel HTF PSP — membandingkan setiap lilin panel HTF simbol carta anda dengan lilin yang sepadan bagi pasangan berkorelasi pada jangka masa yang sama. Apabila kedua-dua pasangan menutup dalam arah bertentangan pada lilin HTF yang sama, berlian oren ◆ muncul di atas atau di bawah lilin panel itu, sedikit terletak melepasi label corak supaya kedua-dua isyarat kekal boleh dibaca tanpa bertindih.
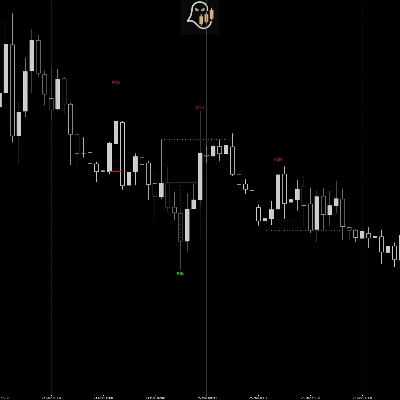
Carta ITF PSP — mengimbas 200 bar terakhir jangka masa carta semasa dan meletakkan ikon berlian oren ◆ terus pada setiap bar di mana simbol anda dan pasangan berkorelasi menutup dalam arah bertentangan. Penapis doji yang boleh dikonfigurasikan (lalai nisbah badan-ke-julat 10%) menghalang lilin ketidaktentuan lemah daripada menghasilkan isyarat PSP palsu.
SMT — Penyimpangan Teknik Wang Pintar
Penyimpangan SMT dikesan pada dua tahap:
Panel HTF SMT — membandingkan tinggi dan rendah lilin panel HTF berturut-turut antara simbol carta anda (pasangan A) dan pasangan berkorelasi (pasangan B). Apabila pasangan A membuat rendah lebih rendah manakala pasangan B membuat rendah lebih tinggi (SMT bullish), atau pasangan A membuat tinggi lebih tinggi manakala pasangan B membuat tinggi lebih rendah (SMT bearish), dua garis dilukis terus dalam panel menghubungkan tahap harga yang menyimpang.
Gaya garis menyampaikan sisi penyimpangan yang diwakili oleh carta semasa anda: garis pepejal menandakan sisi yang disapu/palsu, dan garis titik menandakan sisi yang kuat/dilindungi. Oleh kerana pengesanan adalah simetri, isyarat muncul pada kedua-dua carta GBPUSD dan EURUSD (contohnya) serentak — dengan garis pepejal dan titik bertukar bergantung pada pasangan yang anda lihat.
Pengesanan Pasangan Berkorelasi Automatik
Penunjuk secara automatik menyelesaikan pasangan berkorelasi dari simbol carta menggunakan peta pasangan komprehensif yang merangkumi forex utama, logam, indeks, dan kripto. Tiada konfigurasi manual diperlukan untuk pasangan yang anda dagangkan paling banyak:
Simbol Pasangan Auto
GBPUSD-EURUSD
AUDUSD-NZDUSD
GBPJPY-EURJPY
XAUUSD-XAGUSD
NAS100-US30
US500-NAS100
BTCUSD-ETHUSD
Penyelesai menormalkan nama simbol (mengeluarkan pemisah seperti /, -, _) dan menanggalkan sufiks broker biasa (contoh GBPUSDm, GBPUSD.r, GBPUSD_SB) sebelum carian. Parameter Ganti Simbol Manual membolehkan anda menentukan pasangan berkorelasi tersuai, dan togol Auto-Detect membolehkan anda melumpuhkan penyelesaian automatik sepenuhnya.
Papan Pemuka
Papan pemuka sudut padat (boleh dikonfigurasikan ke mana-mana sudut) menunjukkan:
- HTF — jangka masa lilin panel
- ITF — jangka masa carta semasa anda
- Bias — ▲ Bullish / ▼ Bearish / ── Neutral berdasarkan corak yang dikesan paling baru
- Corak — nama corak khusus (CRT, Pengembangan, Swing Point, PSP)
- Corr — simbol berkorelasi yang diselesaikan
Warna teks papan pemuka sepadan dengan arah bias — hijau untuk bullish, merah untuk bearish, kelabu untuk neutral.
Lukisan Selamat — Garis Anda Tidak Pernah Dipadamkan
Semua objek penunjuk menggunakan awalan dalaman khusus. Hanya objek penunjuk sendiri yang dialih keluar pada setiap lukisan semula. Garis tren yang anda lukis secara manual, segi empat tepat, tahap Fibonacci, dan mana-mana objek alat lukisan lain tidak disentuh sama sekali.
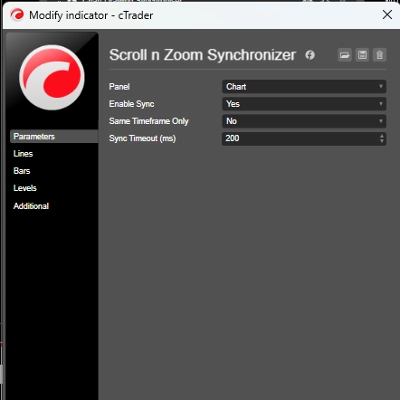
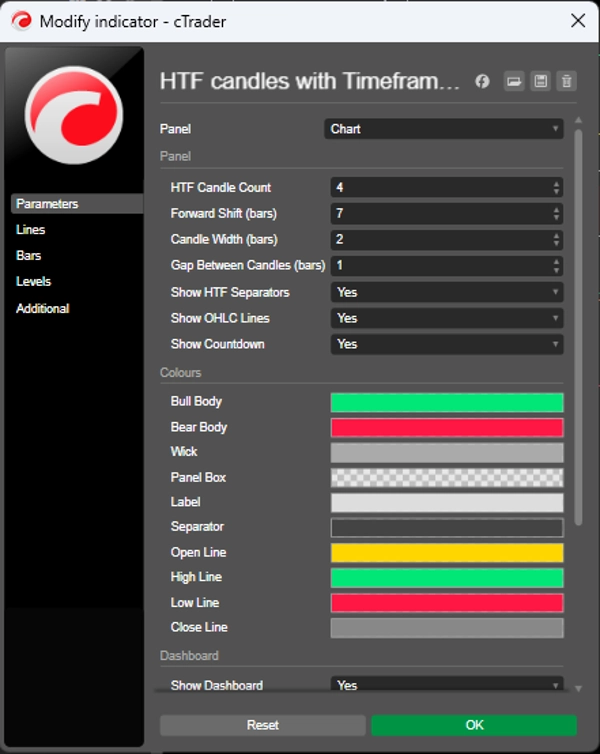
Kumpulan Parameter
Panel — bilangan lilin, pergeseran ke hadapan, lebar lilin, jurang, pemisah, garis OHLC, pemasa undur
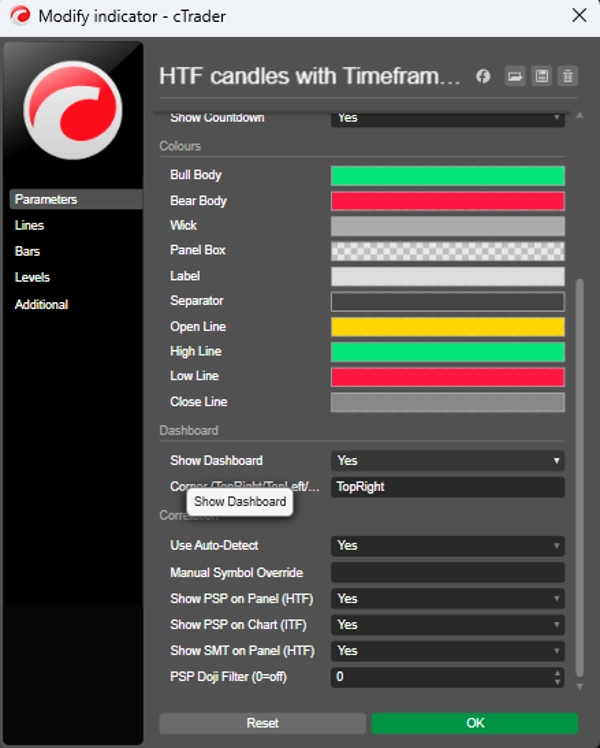
Warna — badan bull, badan bear, sumbu, kotak panel, label, pemisah, warna garis buka/tinggi/rendah/tutup
Papan Pemuka — togol paparan, kedudukan sudut
Korelasi — togol auto-detect, ganti simbol manual, togol panel PSP, togol carta PSP, togol SMT HTF, penapis doji PSP
ITF SMT — togol paparan, lihat ke belakang ayunan, minimum bar antara ayunan, togol bearish/bullish, ketebalan garis, togol label