

Descripción
See any asset's historical performance in one glance — no backtest required.
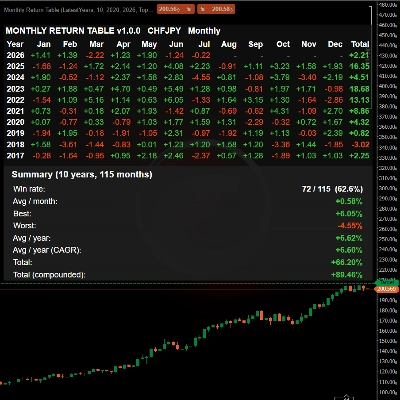
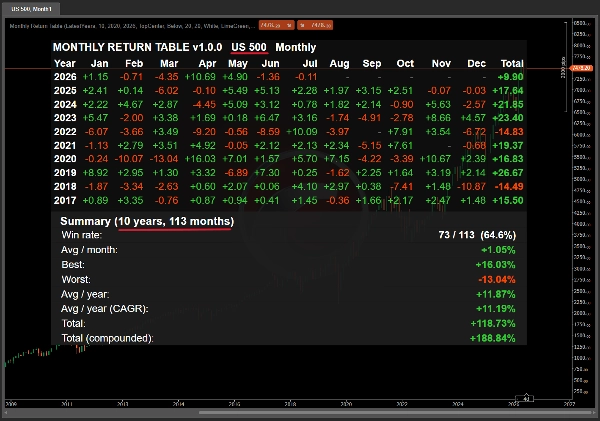
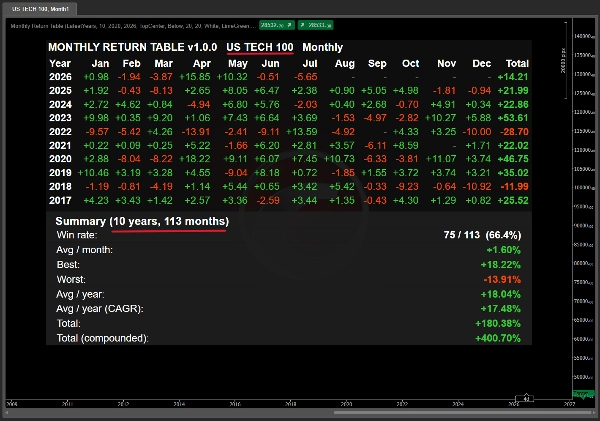
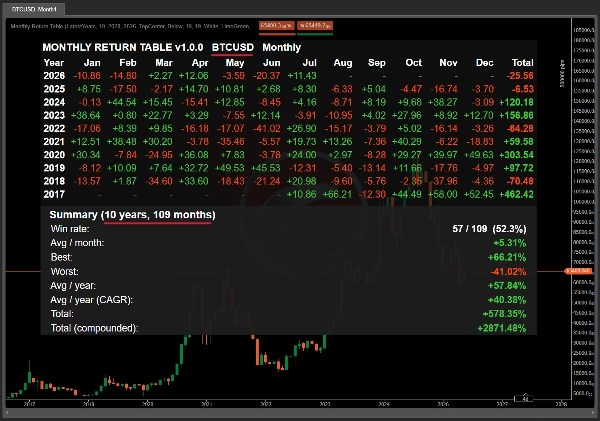
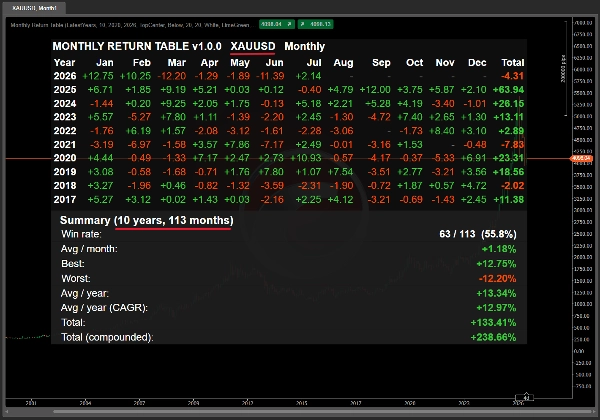
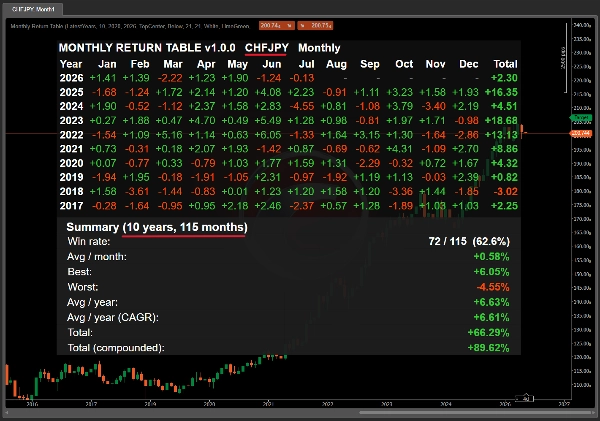
Drop it on any chart. Instantly see monthly returns for the last 10+ years, color-coded by profit and loss, with a full statistical summary. Works on any symbol, any timeframe — Forex, Metals, Indices, Crypto. The fastest way to answer: "Is this asset actually worth trading?"
WHAT IT DOES
Monthly Return Table calculates the monthly percentage return of any asset — open of the first bar of the month to close of the last bar — and displays it as a clean, color-coded matrix directly on your chart.
No backtest. No optimization. No waiting.
Attach it, and the entire performance history appears in under a second.
WHY IT EXISTS
Before you invest capital, deploy a bot, or design a strategy, you should know one thing: how has this asset actually behaved?
Most traders skip this step. They open a chart, see recent price action, and make decisions based on the last few months. Monthly Return Table forces you to look at the full picture — every month, every year, side by side.
You'll immediately see:
• Which months tend to be strong or weak (seasonality)
• Whether the asset trends or ranges over time
• The realistic drawdown you should expect
• The compounded return of simply holding through each month
KEY FEATURES
• Full monthly matrix — 12 months × up to 30 years, all on one screen
• Color-coded cells: green profit, red loss
• Complete statistical summary: Win rate, Avg/month, Best, Worst, Avg/year, CAGR, Total (simple + compounded)
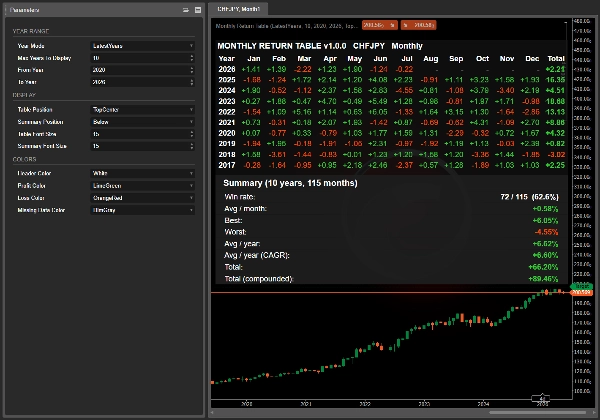
• Year Mode: Latest N years OR specific range (e.g. 2020-2022)
• 9 chart positions, adjustable font sizes, custom colors
• Timezone-aware month detection — works correctly with every broker
• Zero configuration required
• No repainting, no lag, no external data
WHO THIS IS FOR
• Retail traders who want to stop guessing and decide based on real historical data
• Bot users and buyers who want to evaluate a symbol before committing capital
• Portfolio builders comparing candidates for consistent, compoundable returns
• Content creators needing clean, professional performance visualizations
WHAT IT IS NOT
This is not a trading signal. It doesn't tell you when to buy or sell. It doesn't predict the future.
What it does is answer a simple, foundational question every trader should ask before touching an asset: "Show me the numbers."
Stop guessing. Start seeing.
Built by Black Rock — Forex & Gold trading specialists. Full support via cTrader messaging. Updates included.
Resumen
Conversación
Valoraciones de clientes
Preguntas frecuentes
Más de este autor

















Precio