Wstęgi DoubleSMMA
Wskaźnik
68 pobrania
Wersja 1.0, May 2025
Windows, Mac
Opis
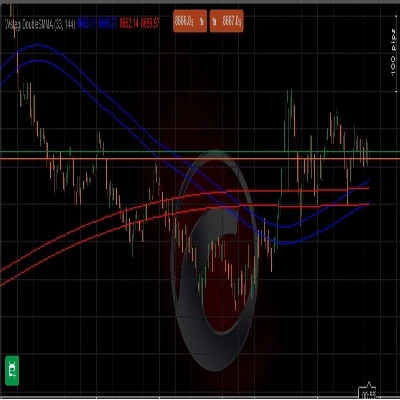
Taśmy HTS SMMA 33 144
Podsumowanie
Podsumowanie AI
Wstęgi DoubleSMMA is a trading indicator featuring HTS SMMA bands with periods of 33 and 144. It is designed to be applied on price charts to assist traders in analyzing market trends and potential support or resistance levels. The indicator uses Smoothed Moving Averages (SMMA) to generate bands that reflect price volatility and trend direction over two different timeframes. This dual-period approach aims to provide a clearer view of market dynamics by combining short- and long-term smoothing. The product is suitable for integration into various trading platforms that support custom indicators.
Profil wskaźnika
Opinie klientów
0.0
Opinie: 0
Opinie klientów
Ten produkt nie ma jeszcze opinii. Wypróbowałeś(-aś) go już? Bądź pierwszy(-a) i powiedz o tym innym!
Dyskusja
Częste pytania
Produkty dostępne za pośrednictwem cTrader Store, w tym boty handlowe, wskaźniki i wtyczki, dostarczane są przez deweloperów zewnętrznych i udostępniane wyłącznie w celach informacyjnych oraz w celu zapewnienia dostępu technicznego. cTrader Store nie jest brokerem i nie zapewnia doradztwa inwestycyjnego, nie udziela spersonalizowanych rekomendacji ani nie gwarantuje przyszłych wyników.
Więcej od tego autora


![Logo „[Hamster-Coder] Pivot Points MTF”](https://cdn.ctrader.com/image/webp/4c143e5a-309c-40e3-a578-f04d1e133ffa_31159)
Cena
Od 16/05/2025
135
Bezpłatne instalacje