
Stochastic RSI Indicator
インジケーター
218 ダウンロード数
バージョン 1.0、Aug 2025
Windows、Mac
説明
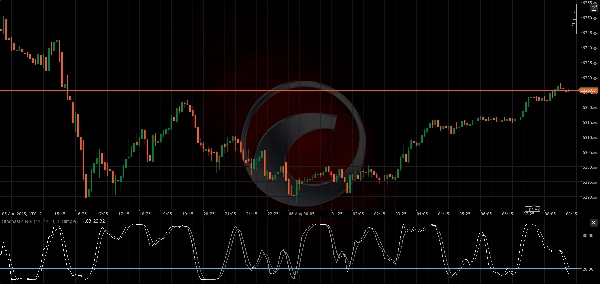
📈 ストキャスティックRSI
この ストキャスティックRSI 指標は、価格ではなくRSI値に ストキャスティックの公式を適用する モメンタムオシレーターであり、二次微分指標です。標準のRSIよりも高い感度で買われ過ぎ・売られ過ぎの状態を特定するのに特に有用です。
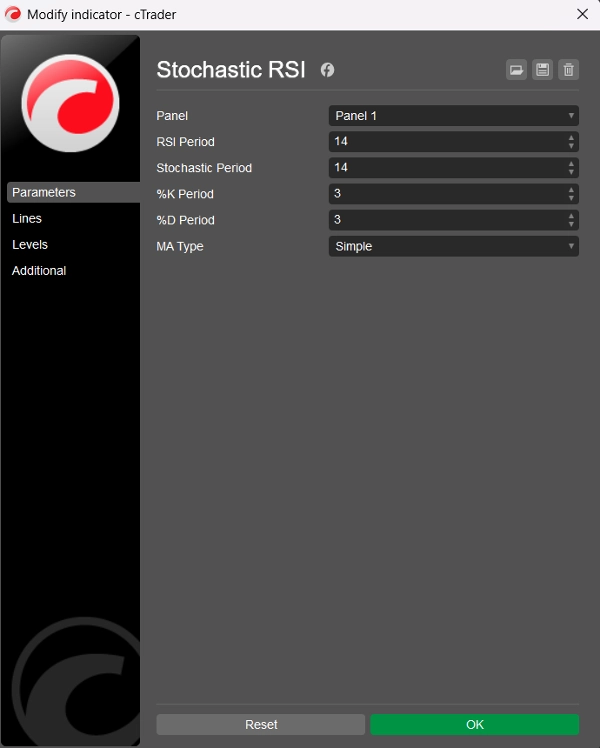
🛠️ パラメーター
RSI期間: 基礎RSIを計算するための遡及期間(デフォルト = 14)
ストキャスティック期間: ストキャスティックRSIを計算するためにRSI値に適用される遡及期間(デフォルト = 14)
%K期間: %Kラインの平滑化期間(デフォルト = 3)
%D期間: %Dラインの平滑化期間(デフォルト = 3)
MAタイプ: 平滑化のための移動平均タイプ:11種類から選択可能(デフォルト = 単純移動平均)
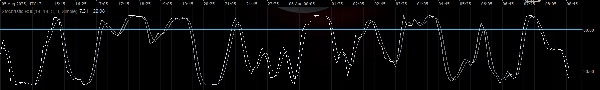
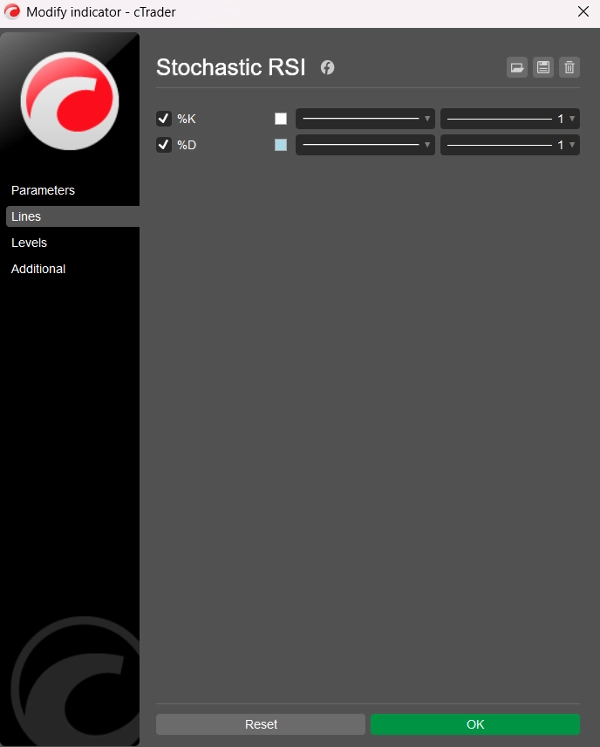
📊 出力ライン
- %Kライン: 平滑化されたストキャスティックRSI(白)
- %Dライン: %Kの平滑化移動平均(ライトブルー)
両ラインは 0から100の間で振動し、買われ過ぎ・売られ過ぎの明確な読み取りを可能にします。
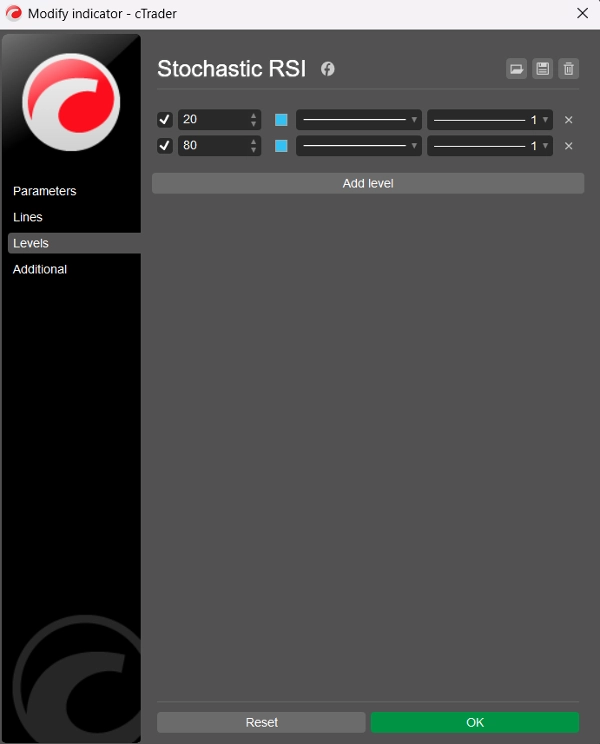
⚠️ 推奨レベル
指標はデフォルトで静的レベルを表示しませんが、ユーザーはcTraderの「レベル」タブから手動で追加することを推奨します:
- レベル80 → 買われ過ぎ
- レベル20 → 売られ過ぎ
これらのレベルは従来のストキャスティックオシレーターと同様に機能しますが、RSIの動きに適用されるため、シグナルがより鋭く、しばしば速くなります。
🧠 使い方
- 買われ過ぎ(>80): 価格が上昇しすぎている可能性があり、反転または調整の可能性があります。
- 売られ過ぎ(<20): 価格が売られ過ぎている可能性があり、反発またはトレンド反転の可能性があります。
- %Kと%Dのクロスオーバー: ストキャスティックやMACDと同様に使用可能で、20以下での強気のクロスオーバーや80以上での弱気のクロスオーバーが取引のサインとなる場合があります。
🏷️ 注意事項
- C#とAutomate APIを使用してcTrader向けに作成
- クリーンで効率的、11種類のMAタイプでカスタマイズ可能
- コードとロジックはBlueRocketBots & ChatGPT(OpenAI)によるもの
- クリーンコード(合計99行;コード54行、テキスト27行、空行18行)
- 改良版V2
- 無料で提供!
概要
AIによる概要
The Stochastic RSI Indicator is a momentum oscillator designed for use on the cTrader platform. It applies the Stochastic formula to Relative Strength Index (RSI) values instead of price data, effectively acting as a second-derivative indicator. This approach enhances sensitivity in detecting overbought and oversold market conditions compared to the standard RSI.
Key parameters include the RSI Period (default 14), Stochastic Period (default 14), %K and %D smoothing periods (default 3 each), and a choice among 11 moving average types for smoothing (default is Simple). The indicator outputs two lines: the %K line (smoothed Stochastic RSI) and the %D line (smoothed moving average of %K), both oscillating between 0 and 100.
Suggested manual levels for interpretation are 80 (overbought) and 20 (oversold). Traders may use these levels along with %K and %D crossovers to identify potential price reversals or consolidations. For example, a bullish crossover below 20 or a bearish crossover above 80 can signal actionable market moves.
The indicator is implemented in clean, efficient C# code using the Automate API, allowing customization and integration within cTrader.
インジケーターのプロフィール
カスタマーレビュー
0.0
レビュー: 0
カスタマーレビュー
この商品にはまだレビューがありません。お使いになったことがある方は、ぜひレビューをお願いします。
ディスカッション
よくあるご質問
cTrader Storeで入手可能な取引ボット、インジケーター、プラグインなどの商品は、第三者の開発者が提供するものであり、情報と技術の取得のみを目的としてご利用いただけます。cTrader Storeはブローカーではなく、投資助言や個人的な推奨を行うことも、将来のパフォーマンスを保証することもありません。


価格
登録日 24/05/2025
220
無料インストール