
Beschreibung
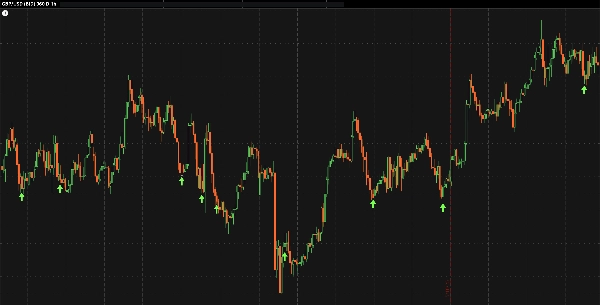
Momentum Reversion Model (MRM) ist ein technischer Indikator, der potenzielle Momentum-Umkehrzonen in der Kursbewegung visualisiert.
Er analysiert die interne Struktur der Marktbewegung, um Bereiche hervorzuheben, in denen der Verkaufsdruck nachlassen und Erholungsmomentum entstehen könnte.
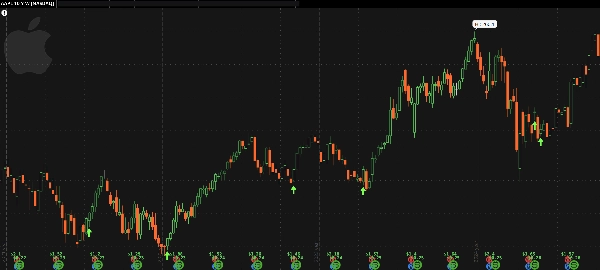
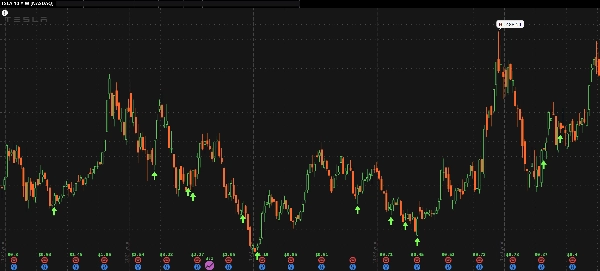
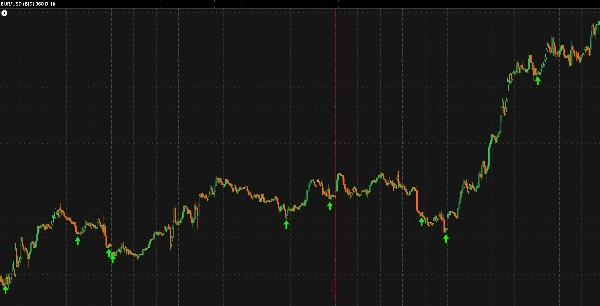
Wenn die internen Modellbedingungen übereinstimmen, zeichnet MRM einen grünen Pfeil unter der Kurskerze — der einen möglichen Umkehrpunkt markiert.
Obwohl hauptsächlich für Forex-Märkte auf 1-Stunden-Charts entwickelt, kann es auch auf wöchentliche Aktienkurse angewendet werden, um ähnliches analytisches Verhalten über Zeitrahmen hinweg zu beobachten.
Dieser Indikator eröffnet oder verwaltet keine Trades. Er bietet eine visuelle Bestätigungsebene , die bestehende technische Strategien oder diskretionäre Setups ergänzen kann.
Hauptmerkmale:
- Hebt potenzielle Erschöpfungs- und Erholungspunkte im Momentum hervor
- Passt sich intern an unterschiedliche Volatilitätsumgebungen an
- Minimale Parameter für konsistentes analytisches Verhalten
💬 Ihr Feedback ist wichtig:
Wenn Sie dieses Tool nützlich finden, hinterlassen Sie bitte eine kurze Bewertung im Store.
Wenn Sie gerne MRM-basierte cBots in Zukunft veröffentlicht sehen möchten, erwähnen Sie dies gerne in Ihrem Feedback — das Interesse der Community hilft direkt, zukünftige Veröffentlichungen zu steuern.
Haftungsausschluss:
Das Momentum Reversion Model wird kostenlos nur zu Analyse- und Bildungszwecken bereitgestellt.
Es stellt keine Finanzberatung, Handelsempfehlung oder Kauf- bzw. Verkaufsempfehlung für ein Instrument dar.
Es wird keine Garantie für Genauigkeit, Leistung oder Ergebnisse gegeben.
Alle Handelsentscheidungen erfolgen vollständig auf eigenes Risiko des Nutzers, und es wird keine Verantwortung für Verluste oder Schäden übernommen, die aus der Nutzung entstehen.


