
Beschreibung
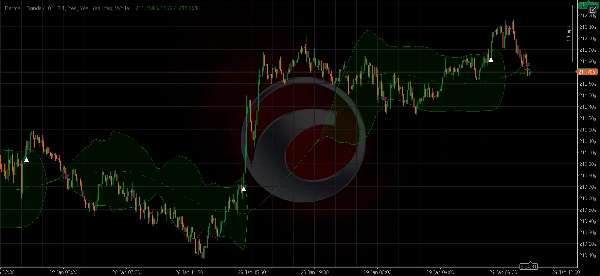
Bermaui Bands (BB) ist ein Werkzeug der technischen Analyse, das hilft, zwischen seitwärts gerichteten und trendenden Kursbewegungen zu unterscheiden. Die Idee hinter diesem Indikator kann in den folgenden Schritten erklärt werden -
- Berechne die Standardabweichung als Oszillator, der sich zwischen 0 und 100 bewegt. Wir nennen ihn Bermaui Deviation Prozent (BD Prozent).
- Wenn „BD Prozent“ nahe bei null liegt, ist die Volatilität extrem hoch. Außerdem, wenn „BD Prozent“ nahe bei 100 liegt, ist die Volatilität sehr niedrig.
- Hohe Volatilität bedeutet eine große Wahrscheinlichkeit für einen trendenden Markt, während niedrige Volatilität einen seitwärts gerichteten oder rangierenden Markt bedeutet.
- Die Mittellinie ist ein einfacher gleitender Durchschnitt, da die Standardabweichung abhängig vom gleitenden Durchschnitt berechnet wird.
- Füge „BD Prozent“ zu einem einfachen gleitenden Durchschnitt mit derselben Anzahl von Balken in der Berechnung hinzu, um das obere Bermaui Band zu erhalten.
- Subtrahiere „BD Prozent“ von einem einfachen gleitenden Durchschnitt mit derselben Anzahl von Balken in der Berechnung, um das untere Bermaui Band zu erhalten.
Zusammenfassung
Indikatorprofil
Kundenbewertungen
0.0
Bewertungen: 0
Kundenbewertungen
Bisher gibt es keine Bewertungen für dieses Produkt. Haben Sie es schon ausprobiert? Dann können Sie die erste Person sein, die andere darüber informiert!
Diskussion
Häufig gestellte Fragen (FAQ)
Forex
Signal
Breakout
Indices
Commodities
Crypto
Stocks
Über den cTrader Store verfügbare Produkte, einschließlich Handelsbots, Indikatoren und Plugins, werden von externen Entwicklern bereitgestellt und nur zu Informations- und technischen Zugriffszwecken verfügbar gemacht. cTrader Store ist kein Broker und erbringt keine Anlageberatung, persönlichen Empfehlungen oder eine Garantie für zukünftige Performance.


![„[Hamster-Coder] Bollinger Bands“-Logo](https://cdn.ctrader.com/image/webp/21d8e5d6-fb11-4bac-b9ee-cd05c2b76804_30327)


Preis
Seit 28/01/2026