Beschreibung
PROPFOLIO MASTER SUITE: BEDIENUNGSANLEITUNG
Plattform: cTrader Version: 1.0 (Store-konforme Edition) Bereitgestellt von: Propfolio Solutions
Willkommen beim PropFolio Peak Formation SMC Dashboard. Dies ist eine vollständige institutionelle Charting-Suite, die Smart Money Concepts (SMC), Beat The Market Maker (BTMM) Tracking und Volumenprofil-Analyse in einem leichtgewichtigen, hochoptimierten cTrader-Indikator vereint.
📥 1. INSTALLATIONSHANDBUCH
- Laden Sie die
PropFolioPeakFormationSMCDashbaord.algoDatei herunter. - Doppelklicken Sie auf die
.algoDatei. cTrader öffnet und installiert sie automatisch. - Öffnen Sie ein beliebiges Chart in cTrader.
- Rechtsklick auf das Chart -> Indikatoren -> Benutzerdefiniert -> Wählen Sie PropFolioPeakFormationSMCDashbaord aus.
- Klicken Sie auf OK, um anzuwenden.
📊 2. DAS DASHBOARD ERKLÄRT
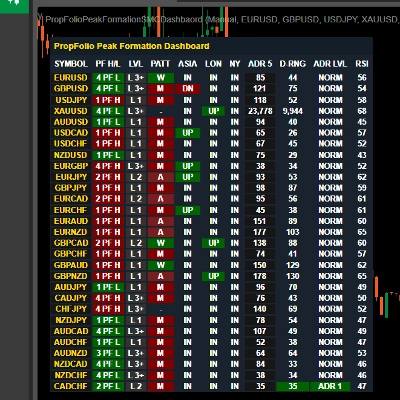
Die Suite verfügt über ein Multi-Symbol-Dashboard, das institutionelle Marktzustände in 11 Spalten in Echtzeit verfolgt.
- SYMBOL: Das verfolgte Währungspaar. Sie können eine benutzerdefinierte Liste in den Indikatoreinstellungen definieren.
- PF H/L (Peak Formation): Zeigt an, ob der aktuelle 5-Tage-Zyklus eine Peak Formation High (PFH) oder Peak Formation Low (PFL) ist und wie viele Tage es her ist, dass sie gebildet wurde.
- LVL (Level): Das aktuelle BTMM-Zykluslevel (Level 1, Level 2 oder Level 3+).
- PATT (Muster): Identifiziert intratägliche institutionelle Muster.
-
- M / W: Standard M- und W-Formationen.
- A / V: A-Tops und V-Bottoms.
- ASIA / LON / NY: Zeigt den aktuellen Preisstatus relativ zur jeweiligen Sitzungsreichweite.
-
- UP (Grün): Der Preis hat das Sitzungs-Hoch überschritten.
- DN (Rot): Der Preis ist unter das Sitzungs-Tief gefallen.
- IN (Grau): Der Preis bewegt sich innerhalb des Sitzungsbereichs.
- ADR 5: Die durchschnittliche tägliche Spanne der letzten 5 Tage (in Pips).
- D-RNG: Die aktuelle Tagesspanne (in Pips).
- ADR LVL: Zeigt an, ob der aktuelle Tag seine ADR ausgeschöpft hat.
-
- NORM: Normale Spanne.
- ADR 1 / 2 / 3: Der Preis hat sich 1x, 2x oder 3x über sein normales Tagesvolumen hinaus bewegt (Erwartung von Erschöpfung/Umkehrungen).
- RSI: 15-Minuten-RSI, um schnell überkaufte (Rot) oder überverkaufte (Grün) Bedingungen zu erkennen.
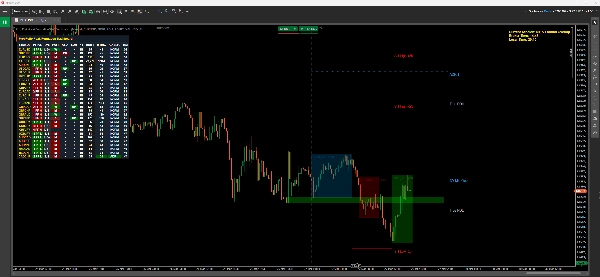
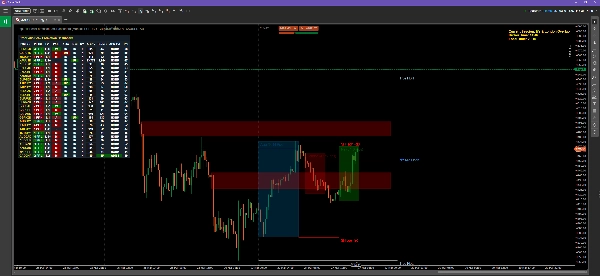
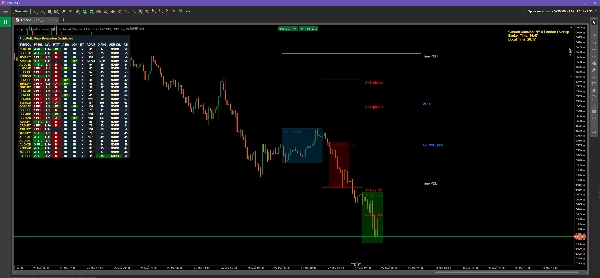
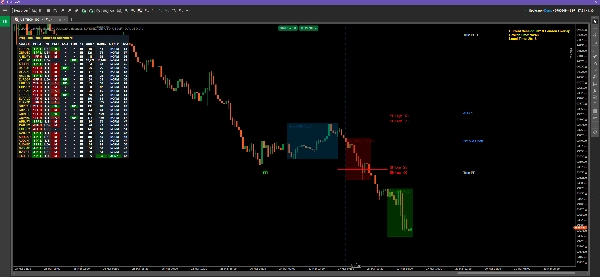
👁️ 3. CHART-VISUALISIERUNGEN & SMC-WERKZEUGE
1. Killzones (Liquiditätsboxen) Der Indikator zeichnet automatisch transparente Boxen für die Asiatische, Londoner und New Yorker Sitzungen. Die Pip-Größe jeder Box wird unten angezeigt.
2. Stop Hunt Linien (BTMM) Linien werden 25 und 50 Pips über und unter der Asiatischen Sitzungsbox gezogen. Dies sind institutionelle Ziele, an denen Market Maker Retail-Stop-Losses jagen, bevor sie den Trend umkehren.
3. True PDH & PDL Silberne Linien markieren das Wahre Hoch des Vortages und Tief des Vortages, berechnet streng vom wahren Asia Open bis zum wahren NY Close (unter Ausschluss von totem Rollover-Volumen).
4. Angebot & Nachfrage (S&D) Die Engine scannt die letzten 150 Kerzen nach institutionellem Ungleichgewicht.
- Rote Boxen: Unabgedecktes Angebot (Verkaufszonen).
- Grüne Boxen: Unabgedeckte Nachfrage (Kaufzonen).
- Hinweis: Zonen verschwinden, sobald der Preis sie vollständig ausgleicht (testet).
5. ADR-Ziellinien Basierend auf der Peak Formation projiziert der Indikator orange oder blaue gestrichelte Linien, die die 1x, 2x und 3x Average Daily Range Erschöpfungsziele für den Tag markieren.
📈 4. VOLUMENPROFIL (Flexibel vs. Fest)
Der Indikator verfügt über eine vollständig integrierte Volumenprofil-Engine, um den Point of Control (POC) und Value Area High/Low (VAH/VAL) zu finden.
So verwenden Sie den FLEXIBLEN Modus:
- Stellen Sie in den Indikatoreinstellungen sicher, dass VP Mode auf
Flexibleeingestellt ist. - Zwei vertikale türkisfarbene gestrichelte Linien erscheinen auf Ihrem Chart.
- Klicken und ziehen Sie diese Linien einfach, um einen beliebigen Preisbereich auf Ihrem Chart zu markieren.
- Das Volumenprofil-Histogramm, POC und Value Area werden sofort berechnet und genau zwischen Ihren beiden Linien ausgerichtet!
So verwenden Sie den FESTEN Modus: Stellen Sie den Modus auf FixedDaily ein. Das Profil berechnet automatisch das Volumen für den aktuellen Handelstag, ohne dass verschiebbare Linien benötigt werden.
⚙️ 5. ZEIT-HUD & ALARME
Erweitertes Zeit-HUD In der oberen rechten Ecke sehen Sie eine goldene Textanzeige. Diese berechnet automatisch die Zeit Ihres Brokers, die lokale Computerzeit und zeigt Ihnen genau an, welche Handelssitzung gerade aktiv ist (z. B. „NY & London Overlap“).
Terminal-Alarme Wenn eine neue Peak Formation auftritt, wird eine Benachrichtigung direkt in Ihrem cTrader Automate -> Log Tab ausgegeben, damit Sie kein Setup verpassen. Hinweis: Für erweiterte externe Push-Benachrichtigungen besuchen Sie bitte unser Propfolio Solutions Entwicklerprofil, um mehr über die erweiterte Suite zu erfahren.
Zusammenfassung
Kundenbewertungen
5 | 100 % | |
4 | 0 % | |
3 | 0 % | |
2 | 0 % | |
1 | 0 % |