Descripción
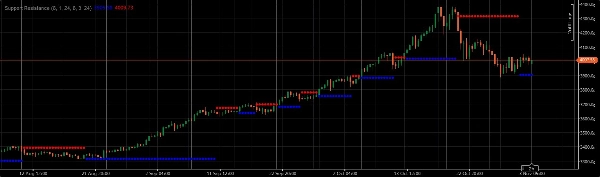
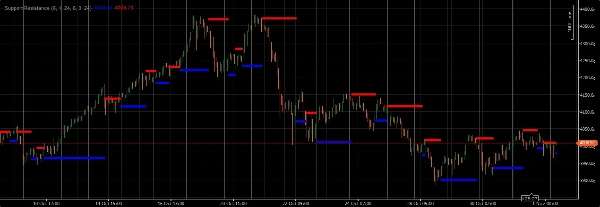
Al operar con oro, utilice niveles de soporte y resistencia en varios marcos temporales (gráficos grandes, de rango y de ticks) para identificar posibles rupturas de pivote o puntos de soporte/resistencia. Siempre confirme estas señales con otros indicadores técnicos como medias móviles, osciladores y patrones de velas para operaciones con mayor probabilidad.
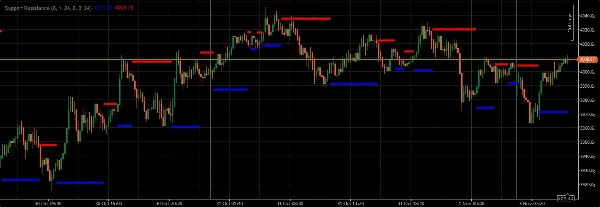
Al operar con oro, utilice niveles de soporte y resistencia en varios marcos temporales (gráficos grandes, de rango y de ticks) para identificar posibles rupturas de pivote o puntos de soporte/resistencia. Al operar con oro, utilice niveles de soporte y resistencia en varios marcos temporales (gráficos grandes, de rango y de ticks) para identificar posibles rupturas de pivote o puntos de soporte/resistencia. Estos niveles, una vez identificados, pueden servir como puntos cruciales para la toma de decisiones. Una ruptura por encima de la resistencia o por debajo del soporte, especialmente cuando va acompañada de un aumento en el cuerpo de la vela, a menudo señala una continuación de la tendencia o un cambio significativo en el sentimiento del mercado. Por el contrario, un rebote en un nivel de soporte o un rechazo en la resistencia puede indicar una posible reversión o una continuación de la consolidación actual. Siempre confirme estas señales con otros indicadores técnicos como medias móviles, osciladores y patrones de velas para operaciones con mayor probabilidad. Además, preste mucha atención a los eventos noticiosos y a la publicación de datos económicos, ya que estos pueden impactar drásticamente los precios del oro e invalidar configuraciones puramente técnicas. La gestión del riesgo es fundamental; nunca arriesgue más de un pequeño porcentaje de su capital de trading en una sola operación.
Resumen
Valoraciones de clientes
5 | 100 % | |
4 | 0 % | |
3 | 0 % | |
2 | 0 % | |
1 | 0 % |


