Descripción
La Ventaja Ponderada por Volumen: Una Hoja de Ruta Completa para el Momentum en cTrader
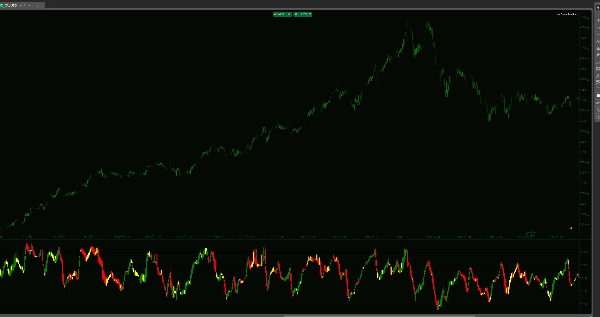
Los indicadores estándar te muestran dónde ha estado el precio. El indicador de Velas RSI Ponderadas por Volumen te muestra la convicción detrás del movimiento. Al fusionar la acción del precio, el volumen de ticks y cinco niveles institucionales críticos, esta herramienta transforma el RSI de un simple oscilador en un sistema integral de mapeo de tendencias.
En lugar de una sola línea, obtienes velas OHLC completas en la ventana de tu indicador. Esto te permite ver la "estructura" del momentum, revelando si un movimiento está respaldado por un volumen institucional pesado o si es simplemente un "engaño" de baja liquidez.
La Estrategia de Ejecución de 5 Zonas
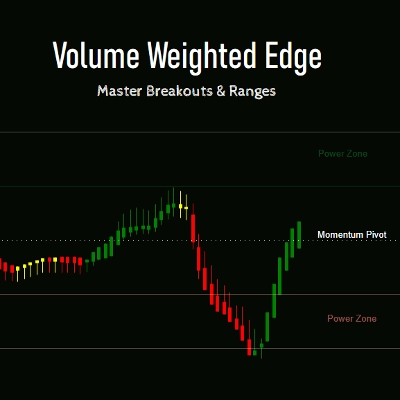
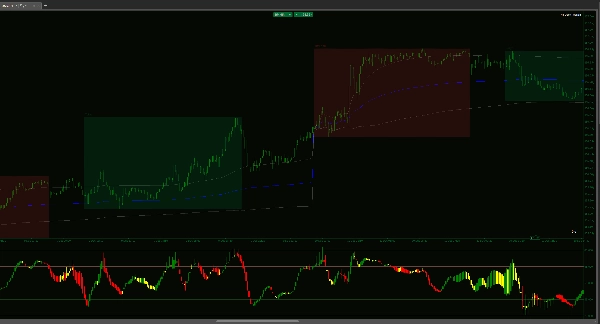
- Las Extensiones de Poder (65–80 & 20–35): Estas son las zonas de alta convicción. Cuando las velas ponderadas por volumen se mantienen aquí, no buscas reversiones, sino que sigues la tendencia. Aquí es donde opera el dinero grande y donde ocurren los movimientos más explosivos.
- Los Corredores de Scalping (50–65 & 35–50): Perfectos para la sesión asiática o mercados en rango. Cuando la tendencia de un marco temporal superior es neutral, estas zonas proporcionan objetivos de "reversión a la media" de alta probabilidad. Si el mercado está en rango, estos corredores te permiten hacer scalping de las rotaciones con precisión quirúrgica.
- El Punto de Inflexión del Momentum (50): La línea definitiva en la arena. El cierre del cuerpo de una vela ponderada por volumen cruzando este nivel es tu primera advertencia de un cambio estructural en el control del mercado.
Por Qué Esta Herramienta Cambia Tu Flujo de Trabajo
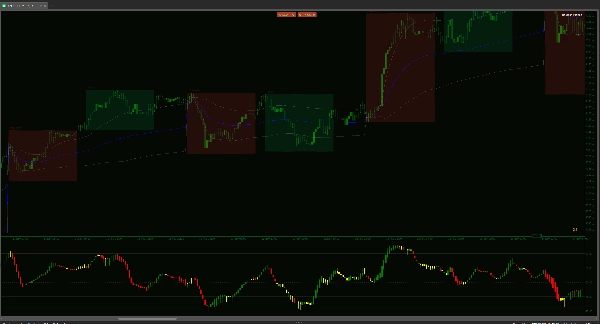
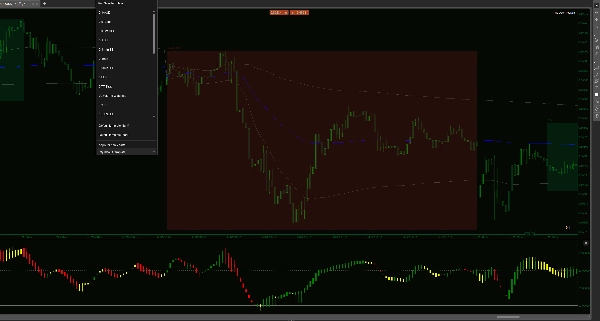
Claridad Ponderada por Volumen: Cada vela se calcula multiplicando el cambio de precio por el volumen de ticks. Si un movimiento ocurre con bajo volumen, la vela RSI no lo confirmará. Esto te mantiene fuera de movimientos "trampa" que parecen buenos en el gráfico de precios pero no tienen respaldo.
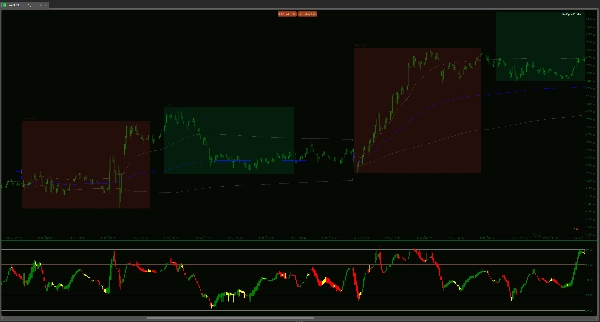
Perspectivas del Cuerpo de la Vela: Las líneas RSI tradicionales son nerviosas y dentadas. Nuestras velas suavizadas con WMA te muestran la "apertura" y el "cierre" del momentum. Si el cuerpo de la vela RSI es grueso y sólido, la tendencia es saludable. Si las mechas son largas, el momentum está agotado.
Versatilidad Multi-Mercado: * Tendencia: Usa el rango 65–80 para mantenerte más tiempo en operaciones ganadoras.
Rango/Scalping: Usa los corredores 35–65 para capturar rotaciones rápidas durante sesiones de menor volatilidad como Asia.
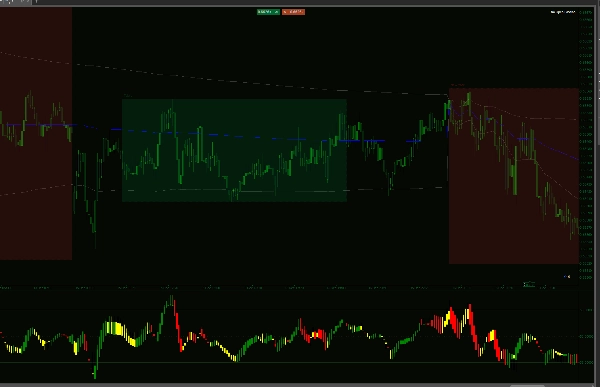
Evita la Trampa del "Código de Barras": La mayoría de los indicadores te obligan a adivinar durante períodos de baja volatilidad. Este indicador presenta un efecto visual único de "Código de Barras" durante la consolidación. Cuando las velas se estrechan, aplanan y se vuelven neutrales, el indicador te está diciendo que el "motor del mercado" está apagado. Esta advertencia visual te salva de entrar en falsos movimientos de bajo volumen y de ser "picado" cuando no hay dinero real detrás del movimiento del precio.
Optimización Nativa para cTrader: Construido específicamente para la API C# con lógica de "Máximo de Velas Visuales" para asegurar que tu plataforma permanezca receptiva, incluso en gráficos de 1 minuto.
Deja de operar basándote en hacia dónde podría ir el mercado. Empieza a operar basándote en hacia dónde el volumen realmente lo está empujando. Este indicador no se trata solo de señales, sino de entender la energía interna del mercado.
Resumen
Valoraciones de clientes
5 | 33 % | |
4 | 67 % | |
3 | 0 % | |
2 | 0 % | |
1 | 0 % |


