
Descripción
El Problema: Sobrecarga de Información
La mayoría de los traders fracasan porque sus gráficos están saturados con indicadores rezagados y demasiadas líneas. Pierden de vista lo más importante: la Estructura del Mercado.
La Solución: Estructura de Sesgo de Tendencia
Este indicador es una potencia "Dos en Uno" para la plataforma cTrader. Combina un Detección de Swing de nivel profesional con un Motor de Puntuación objetivo que te dice exactamente quién controla el mercado.
Características Clave:
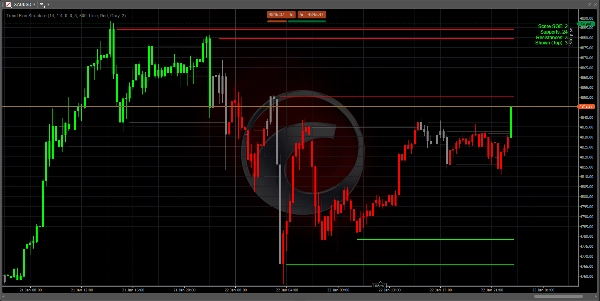
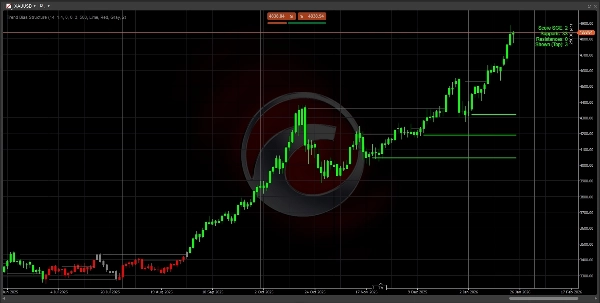
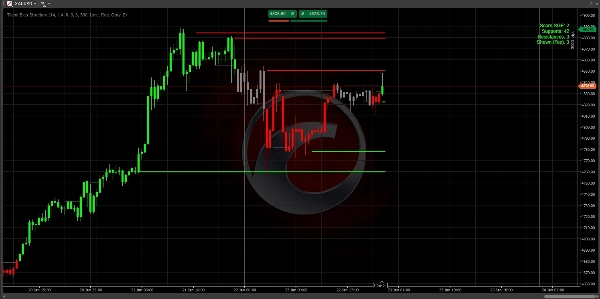
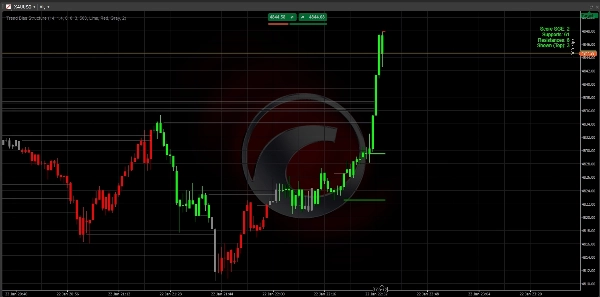
- Mapeo Inteligente de Estructura: Identifica automáticamente niveles significativos de Soporte y Resistencia usando volatilidad filtrada por ATR.
- El Motor de Puntuación SGE: Un sistema único de calificación (-2, 0, +2) que calcula la fuerza de la tendencia basado en cuántos niveles estructurales han sido superados.
- Tecnología Anti-Saturación: Muestra solo los 3 niveles relevantes más cercanos al precio actual. Tu gráfico se mantiene limpio, profesional y accionable.
- Detección de Momentum: Usa la lógica de "Vela Grande" para asegurar que solo operes movimientos con respaldo institucional real.
- Totalmente Personalizable: Ajusta la sensibilidad para tu activo específico (XAUUSD, Forex o Índices).
Cómo Operar con él:
- Revisa la Puntuación: Busca +2 (Alcista) o -2 (Bajista).
- Espera el Retroceso: Deja que el precio regrese a una de las Líneas de Estructura dibujadas.
- Ejecuta: Opera con el sesgo, usando los niveles como anclas de entrada/salida.
Especificaciones Técnicas
- Plataforma: cTrader
- Lenguaje: C# (.NET)
- Marcos Temporales: Funciona en todos los marcos temporales (M1 a Mensual).
- Activos: Optimizado para pares de alta liquidez (XAUUSD, EURUSD, GBPUSD).
Nota: Configuraciones Iniciales: Para la mayoría de los pares principales, las configuraciones predeterminadas están optimizadas. Si operas índices volátiles, puede que desees aumentar el Range Global ATR Mult a 2.0
Importante: Cómo Leer el Panel de Control
El panel en la esquina superior derecha es tu centro de mando:
- Puntuación +2 (Verde): Fuerte Alcista. Solo busca configuraciones de Compra.
- Puntuación -2 (Rojo): Fuerte Bajista. Solo busca configuraciones de Venta.
- Puntuación 0 (Gris): Neutral. El mercado está en rango o en transición. Mantente paciente.
- Soportes/Resistencias: Muestra cuántos "pisos" y "techos" históricos existen en la tendencia actual.
Estrategia de Entrada en 3 Pasos
Paso 1: Identificar el Sesgo Espera a que los colores de las velas y la puntuación del panel lleguen a +2 o -2. Esto confirma que el mercado ha roto la estructura y que una tendencia está comenzando.
Paso 2: El Área de Valor No persigas el precio. Espera a que el precio retroceda (retracement) hacia una de las 3 líneas más cercanas dibujadas en tu gráfico.
- En una tendencia bajista (Puntuación -2), espera a que el precio toque una Línea Roja.
- En una tendencia alcista (Puntuación +2), espera a que el precio toque una Línea Verde.
Paso 3: Ejecución Entra en tu operación cuando el precio toque la línea y muestre un rechazo (formación de mecha).
- Stop Loss: Coloca tu SL justo detrás de la línea estructural.
- Take Profit: Apunta a la siguiente línea estructural en la dirección de la tendencia.
Consejos Profesionales para el Éxito
- Regla de Marcos Temporales Superiores: Una puntuación de +2 en el H4 o D1 es mucho más poderosa que una puntuación en el gráfico M5. Usa el marco temporal superior para encontrar el sesgo y el inferior para encontrar tu entrada.
- Gráficos Limpios: Si la pantalla se siente saturada, ve a configuraciones y cambia
Max Levels to Showa 2. Esto mostrará solo el "Piso" y "Techo" más críticos. - La Zona "Cero": Cuando la puntuación es 0, el mercado está "recalculando." Este es el mejor momento para tomar ganancias de operaciones previas y esperar una nueva ruptura.
Solución de Problemas
- ¿No se Ven Líneas? Verifica si tienes suficiente historial cargado en tu gráfico. El indicador necesita al menos 100-200 barras para calcular el ATR y los niveles de Swing.
- ¿Retraso del Indicador? Si tu PC es lento, reduce la configuración de
Max Historical Linesa 200 para liberar memoria más rápido.
Preguntas Frecuentes (FAQ)
P: ¿Este indicador repinta?
R: No. Los niveles y puntuaciones se calculan basándose en cierres de vela confirmados. Una vez que un nivel es roto o una puntuación cambia al cierre de una vela, queda fijado en el historial.
P: ¿Cuál es el mejor marco temporal?
R: La lógica es universal. Sin embargo, la mayoría de traders profesionales lo usan en gráficos H1, H4 o Diario para identificar la "Estructura Institucional." Si haces scalping en M1 o M5, espera cambios de puntuación más frecuentes.
P: ¿Puedo usar esto con otros indicadores?
R: ¡Sí! Funciona perfectamente como un "Filtro Direccional." Por ejemplo, solo toma señales de RSI sobrevendido si la Puntuación de Sesgo de Tendencia es +2.
¡Feliz Trading!
No es Asesoramiento Financiero. El indicador Trend Bias Structure es una herramienta de análisis técnico diseñada para ayudar a los traders a identificar la estructura del mercado y el sesgo de tendencia.
Resumen
Key features include:
- Smart Structure Mapping: Automatically detects significant support and resistance levels filtered by ATR-based volatility.
- SGE Scoring Engine: Calculates trend strength by counting breached structural levels.
- Anti-Clutter Display: Shows only the three closest relevant levels to maintain chart clarity.
- Momentum Detection: Uses "Big Candle" logic to highlight moves with institutional backing.
- Customizable sensitivity for different assets such as XAUUSD, EURUSD, GBPUSD, and indices.
The indicator works on all timeframes from 1 minute to monthly, with professional traders typically using H1, H4, or daily charts to identify institutional structure. The dashboard provides a clear bias score and structural levels to guide trade entries and exits. Users are advised to trade with the bias, waiting for price pullbacks to the nearest structure lines before executing trades.
This tool is intended as a directional filter and can be combined with other indicators like RSI. It does not repaint, as calculations are based on confirmed candle closes.
Valoraciones de clientes
5 | 100 % | |
4 | 0 % | |
3 | 0 % | |
2 | 0 % | |
1 | 0 % |


