
LogicLadder Pivots – ماسح متقدم لهياكل السوق والأنماط
افتح الهيكل الخفي للسوق مع LogicLadder Pivots.
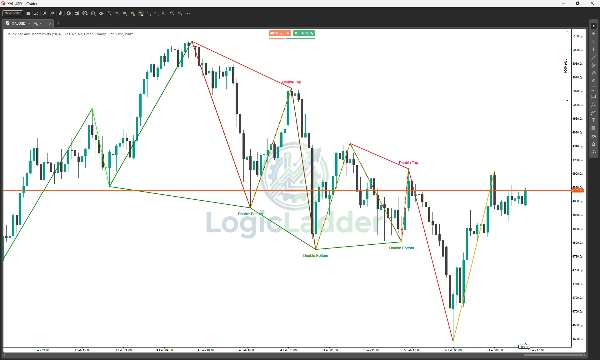
مؤشر LogicLadder Pivots هو أداة احترافية لتحليل حركة السعر مصممة لمساعدة المتداولين على تصور هيكل السوق، وتحديد الاتجاهات، واكتشاف أنماط الانعكاس ذات الاحتمالية العالية تلقائيًا. من خلال دمج منطق ZigZag الكلاسيكي مع المراقبة المتقدمة متعددة الأطر الزمنية، تعمل هذه الأداة كمحلل السوق الشخصي الخاص بك، مع الحفاظ على نظافة المخططات وتنبيهك إلى تحركات السعر الحرجة.
🚀 الميزات الرئيسية
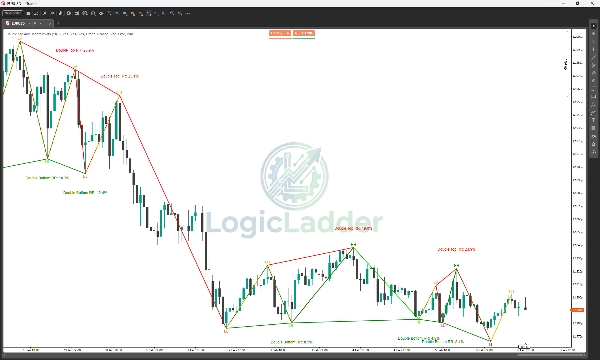
- هيكل السوق الآلي: يضع تلقائيًا علامات القمم الأعلى (HH)، القمم الأدنى (LH)، القيعان الأعلى (HL)، و القيعان الأدنى (LL)، مما يمنحك قراءة فورية لاتجاه الاتجاه الحالي.
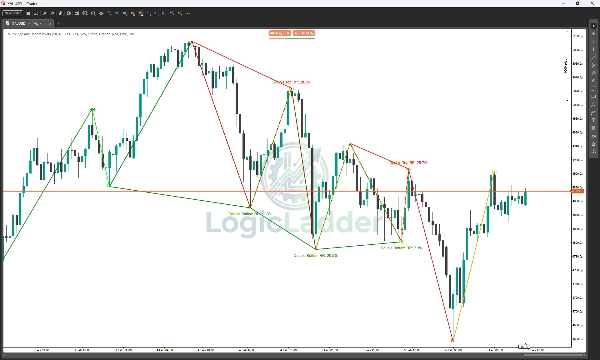
- كشف الأنماط الذكي: يفحص تشكيلات القمة المزدوجة والقاع المزدوج في الوقت الحقيقي. لا يكتفي بإيجاد الأنماط؛ بل يقوم بترشيحها بناءً على نسبة المخاطرة إلى المكافأة (RR) المحسوبة لضمان رؤية أكثر الإعدادات قابلية للتنفيذ فقط.
- تنبيهات متعددة الأطر الزمنية (MTF): راقب إطارًا زمنيًا أعلى (مثل H4 أو يومي) أثناء التداول على إطار زمني أدنى. سينبهك المؤشر عند تكوين نقاط محورية رئيسية على إطار المراقبة الخاص بك، مما يضمن عدم التداول ضد الاتجاه الرئيسي.
- لوحة إحصائيات تفاعلية: لوحة نظيفة على المخطط تعرض الحالة الحالية لكشف الأنماط (جارٍ الفحص، تم اكتشاف القمة المزدوجة، إلخ).
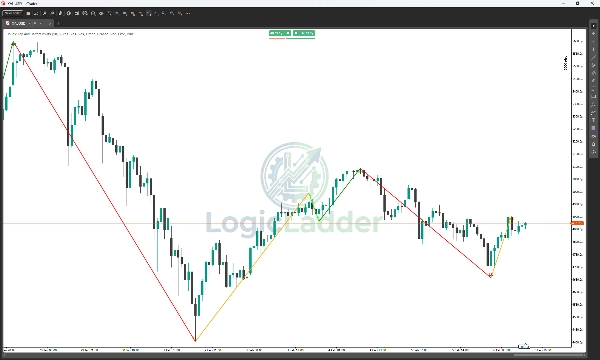
- تصور ZigZag: يرسم خطوط اتجاه واضحة وقابلة للتخصيص تقطع الضوضاء، مما يساعدك على التركيز على تقلبات السعر المهمة.
- قابل للتخصيص بالكامل: خصص كل جانب من جوانب المؤشر وفقًا لأسلوب تداولك. اضبط حساسية النقاط المحورية (الطول)، وغير الألوان للهياكل الصاعدة/الهابطة، وقم بتشغيل أو إيقاف العناصر المرئية المميزة.
🎨 الدليل البصري واستراتيجية الألوان
يستخدم نظام LogicLadder رمز ألوان محدد مكون من 4 ألوان ليخبرك بقصة هيكل السوق على الفور. إليك كيفية قراءة "السلم":
1. 🟢 أخضر (صاعد - قوي)
- ما هو: يستخدم لـ القمم الأعلى (HH).
- ماذا يعني: المشترون في السيطرة الكاملة. السوق يحقق قممًا جديدة.
- الإجراء: ابحث عن فرص شراء أو احتفظ بالمراكز الطويلة الحالية.
2. 🔴 أحمر (هابط - قوي)
- ما هو: يستخدم لـ القيعان الأدنى (LL).
- ماذا يعني: البائعون في السيطرة الكاملة. السوق ينهار إلى أدنى مستويات جديدة.
- الإجراء: ابحث عن فرص بيع أو احتفظ بالمراكز القصيرة الحالية.
3. 🟠 برتقالي (فخ الثيران - ضعف)
- ما هو: يستخدم لـ القمم الأدنى (LH).
- ماذا يعني: حاول المشترون دفع السعر للأعلى لكنهم فشلوا في كسر القمة السابقة. هذا "فخ ثيران" — المشترون المتأخرون محاصرون الآن مع تلاشي الزخم.
- الإجراء: إشارة تحذير! إذا كنت في مركز شراء، فكر في جني الأرباح. راقب احتمال انعكاس الاتجاه نحو الهبوط.
4. 🟢 أخضر فاتح (فخ الدببة - قوة)
- ما هو: يستخدم لـ القيعان الأعلى (HL).
- ماذا يعني: حاول البائعون دفع السعر للأسفل لكنهم فشلوا في كسر القاع السابق. هذا "فخ دببة" — البائعون المتأخرون محاصرون مع استمرار الدعم.
- الإجراء: إشارة فرصة! غالبًا ما يشير هذا إلى بداية اتجاه صاعد جديد. راقب إشارات الدخول للشراء.
📉 كيفية التداول باستخدام "السلم"
- وضع الاتجاه الصاعد: تريد رؤية نمط من الأخضر (HH) متصل بـ الأخضر الفاتح (HL). هذا يؤكد سلمًا صحيًا صاعدًا.
- وضع الاتجاه الهابط: تريد رؤية نمط من الأحمر (LL) متصل بـ البرتقالي (LH). هذا يؤكد سلمًا هابطًا حادًا.
- كشف الانعكاس:
-
- قمة محتملة: إذا رأيت أخضر (HH) يتبعه فورًا برتقالي (LH)، فإن الاتجاه الصاعد يفقد طاقته.
- قاع محتمل: إذا رأيت أحمر (LL) يتبعه فورًا أخضر فاتح (HL)، فإن ضغط البيع قد استُنفد.
💡 كيف يعمل
- تحليل النقاط المحورية: يحلل المؤشر فترة نظر محددة من المستخدم (الافتراضي: 10 أشرطة) لتحديد قمم وقيعان هامة.
- منطق الاتجاه: يربط هذه النقاط لتصور "السلم" للسعر — موضحًا لك بالضبط متى يكسر الاتجاه الهيكل أو يحترم الدعم/المقاومة.
- تأكيد الانعكاس: عندما يشكل حركة السعر هيكل "W" (قاع مزدوج) أو "M" (قمة مزدوجة) التي تلبي معايير المخاطرة/المكافأة الخاصة بك، يرسم المؤشر النمط على المخطط ويحدث لوحة الحالة.
🔔 التنبيهات والإشعارات
ابقَ على اطلاع دون الحاجة إلى التحديق في الشاشة. يتضمن LogicLadder Pivots نظام تنبيه قوي:
- تنبيهات السجل: رسائل مفصلة تُطبع في سجل cTrader عند حدوث أنماط أو نقاط محورية.
- مراقبة MTF: يتم إعلامك عندما يتكون نقطة محورية عالية أو منخفضة هيكلية على الإطار الزمني التنبيهي المختار (مثل تلقي تنبيه لنقطة محورية منخفضة على إطار 4 ساعات أثناء التداول على مخطط 5 دقائق).
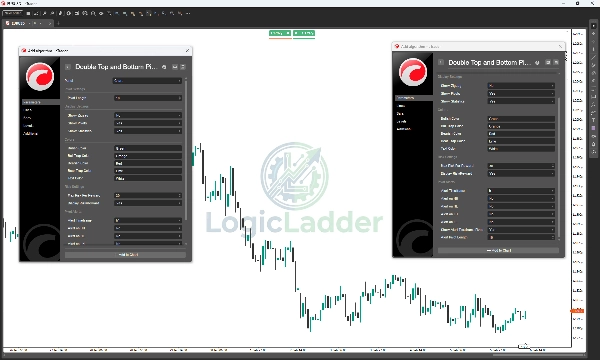
⚙️ المعلمات
- طول النقطة المحورية: حساسية اكتشاف التقلبات.
- إزاحة التسمية: ضبط مسافة تسميات النص من فتائل الشموع لتحسين الرؤية.
- أقصى مخاطرة لكل مكافأة: ترشيح الأنماط بناءً على الكفاءة (الافتراضي: 30%).
- الإطار الزمني للتنبيه: اختر إطارًا زمنيًا ثانويًا للمراقبة.
- الإعدادات المرئية: تحكم كامل في الألوان للحركات الصاعدة، الهابطة، والفخاخ.


