
何ができるか
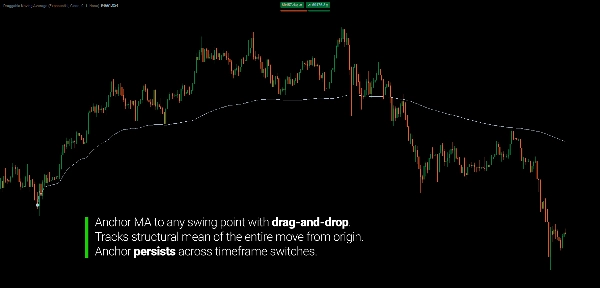
ドラッガブル移動平均は、移動平均を価格履歴の任意のポイントに固定します — バーゼロからではなく、固定された遡及期間からでもなく、まさにあなたが配置した場所からです。
標準的な移動平均はチャートデータの開始から始まり、時間とともに収束します。期間は固定されています。開始の基準は任意です。特定の構造的な出来事 — 修正の開始、インパルスの始まり、重要なスイング — から価格がどのように変化したかを測定したい場合、その瞬間にMAを固定する方法はありません。
このインジケーターはそれを解決します。
アンカーアイコンを任意のバーに配置してください。MAはそのバーから始まり、前方に伸びます。アイコンを別のバーにドラッグすると、MAは新しい位置から即座に再計算されます。時間軸を切り替えても、アンカーは保持され、新しいチャート上で自動的にMAが再計算されます。
結果として、常にあなたが定義した特定の構造的ポイントから価格がどのように変化したかを反映する移動平均が得られます。
コアの利点
標準的なアプローチ:
- 修正またはインパルスの動きの開始を特定する
- 固定期間のMAを適用する — チャートの開始から始まり、構造からではない
- 期間を手動で調整して構造の長さに近づける
- 時間軸を切り替える — 期間は異なるバー数で意味をなさなくなる
- 構造が変わるたびに繰り返す
ドラッガブルアプローチ:
- 構造の開始にアンカーを置く
- MAはその正確なバーから前方に計算される
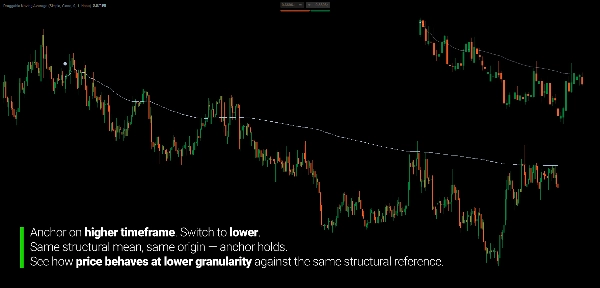
- 時間軸を切り替える — アンカーは保持され、MAは自動的に再計算される
- ドラッグで調整 — すべてが即座に更新される
違いは構造的です。期間調整で参照点を近似する代わりに、直接それを定義します。構造的ポイントが入力であり、期間ではありません。
構造に固定:平均回帰と反転検出
移動平均が構造的スイングポイント — トレンドの起点、インパルスの始まり、修正の開始 — から始まるとき、それは任意の平滑化線ではなく、構造的平均として機能し始めます。
価格はその平均の周りで予測可能な方法で動きます:
- 動きの間、価格は固定されたMAの周りで振動します — モメンタムの急増時には離れ、統合時にはMAに戻ります。MAは起点からの全構造の平均価格を反映し、単なる最近のバーだけではありません。
- 疲弊時、価格は固定されたMAを跳ね返るのではなく横切り始めます。上向きの固定MAの下での終値 — 起点からのインパルスを追跡したもの — は構造的な重要性を持ちます。全動きの平均が破られています。
- 反転後、固定されたMAは抵抗となります。下からのMAの再テストは、以前の構造的平均が供給として機能する論理的な領域を示します。
この挙動は一貫しています。なぜならMAは正しいものを測定しているからです:任意の期間ではなく、実際の開始点からの特定の構造的動きの平均価格です。
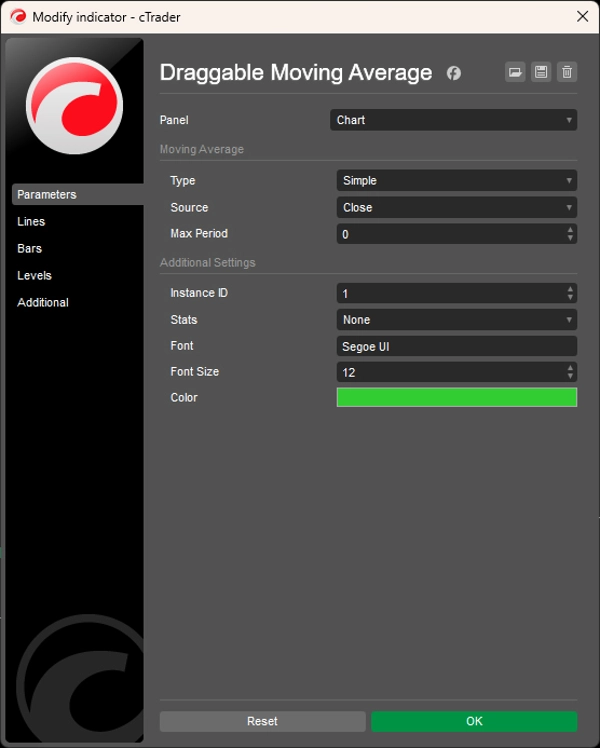
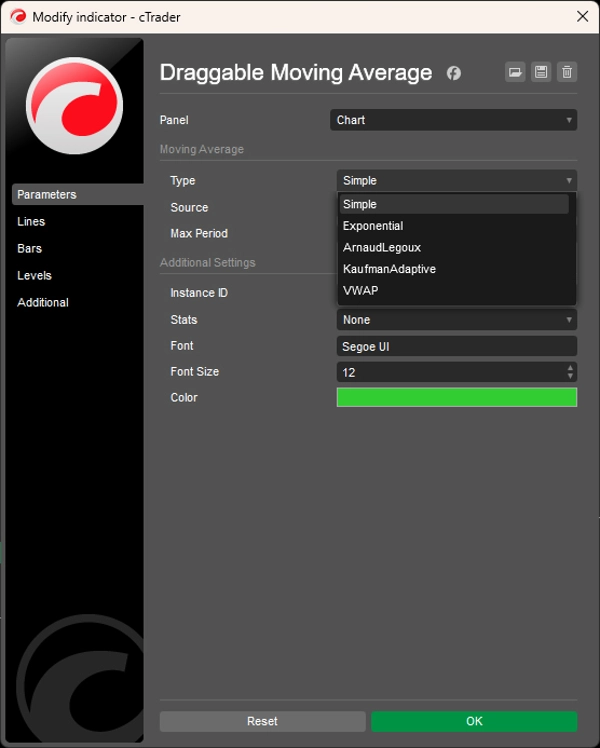
対応MAタイプ
インスタンスごとに選択可能な5つの計算方法:
- 単純(SMA) — アンカーから前方への算術平均;最大期間に達するまでバーごとに増加
- 指数(EMA) — 指数加重;最近の価格変動により敏感
- アルノー・ルグー(ALMA) — ガウス加重;遅延を減らしノイズを増幅しない
- カウフマン適応(KAMA) — 市場効率比に基づき平滑化を動的に調整;トレンド時にタイトに、統合時に広がる
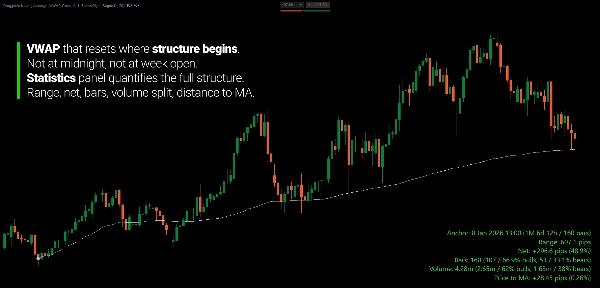
- VWAP — アンカーからの出来高加重平均;構造的ポイント以降の取引量の多い場所を反映
すべてのタイプは最大期間パラメータを尊重します — アンカーを起点としながら遡及ウィンドウを制限します。
統計パネル
オプションのオーバーレイパネルは4つのコーナー位置から選択可能で、アンカーから現在のバーまでのリアルタイム指標を表示します:
- ピップスの範囲(最高値から最安値まで)
- ピップスおよびパーセンテージでの純変化
- 強気/弱気のバー数と割合の合計
- 強気/弱気の出来高分割と割合の合計
- MAからの現在価格の距離(ピップスおよびパーセンテージ)
- アンカーバーから現在のバーまでの期間とバー数カウンター
これは、単にMAラインだけでなく、起点から現在までの価格動きの完全な統計プロファイルを定量化するのに役立ちます。
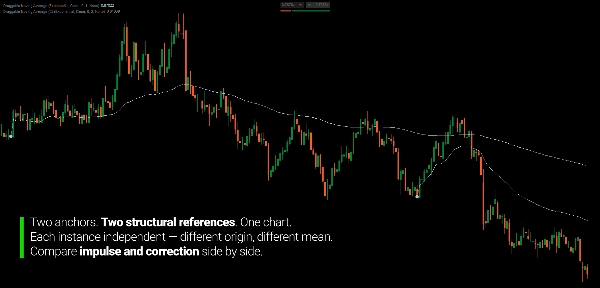
マルチインスタンス対応
各インスタンスは固有のインスタンスIDを持ちます。複数のインスタンスを同時に実行可能 — 1つは修正の開始に固定、別のは前のインパルスに固定 — アイコンやラベルの競合なしに。
主な特徴
- ドラッグ可能なアンカーアイコン — 任意のバーに配置、ドラッグで調整、MAは即座に更新
- 5つのMAタイプ(SMA、EMA、ALMA、KAMA、VWAP)
- 8つの価格ソース(始値、高値、安値、終値、平均、中央値、典型値、加重)
- アンカー起点のローリングウィンドウによる最大期間制限
- 4つのコーナー位置から選べるオプションの統計パネル
- 固有のインスタンスIDによるマルチインスタンス対応
- 時間軸切り替え時のアンカーの持続
対象ユーザー
このインジケーターは、時間軸を超えた市場構造を分析するトレーダー向けです — 特に任意の遡及期間ではなく、定義された構造的参照点から価格の動きを測定したい方に。
高時間軸で修正やインパルスの足を分析し、低時間軸の粒度で同じ構造を評価する必要がある場合、ドラッガブルアンカーは構造の開始点を一度マークし、時間軸ビュー間で持ち運ぶことができます。日足チャートにアンカーを置き、M15に切り替えても参照は保持されます。
これはスイングおよびポジショントレーダーで、固定期間ではなく構造的な動きで考える方、マルチタイムフレーム分析者でチャート間で一貫した参照点が必要な方、そして裁量トレーダーで期間の推測なしに正確なユーザー定義MAアンカーを求める方に適しています。
これはシグナルシステムではありません。価格の動きをすでに考慮しているトレーダー向けの構造的測定ツールであり、移動平均がその動きを正確に反映することを目的としています。
何が違うのか
標準的な移動平均は期間ベースです。参照は暗黙的で — 現在のバーからnバー前です。構造的な動きが終わり新しい動きが始まると、期間は無意味になります。標準MAは特定のイベントを指し示すことはできません。
このインジケーターは参照を明示的にします。構造的イベントにアンカーを置き、そこからMAが測定されます。期間は入力ではなく、構造的ポイントが入力です。
結果として、実際の構造分析を反映する移動平均が得られます。単なる近似ではありません。
---
移動平均を構造的平均として理解する
移動平均はサポートやレジスタンスレベルとして誤解されがちです。トレーダーは価格が50MAを「尊重」したり、200MAから跳ね返るのを待ちますが、それらの数字に固有の市場の意味があるわけではありません。
移動平均は分布の算術的記述です — 定義されたウィンドウ内の平均価格です。その線が意味を持つかどうかを決めるのは式ではなく、測定されているウィンドウが構造的関連性を持つかどうかです。
これが期間ベースのMAが根本的に制限される理由です。50期間MAは直近50バーを測定します — これはどの構造的イベントとも関係のないウィンドウです。トレンドの始まりや修正の開始に対応していません。単に最近性だけで決まる任意の長さのローリングウィンドウです。
構造的スイングポイントにアンカーを置くと、MAはその起点から前方への特定で一貫した価格分布の平均になります。価格がそれを大きく上回ると、起点で参加した参加者は含み益が伸びています。価格がそれに戻ると、分布のリバランスを反映します。価格がそれを明確に突破すると、構造的起点からの平均参加者は損益分岐点か損失状態にある — これは線が破られたのではなく統計的なレジーム変化です。
幾何学は原因ではありません。あなたが定義した構造的分布の境界の統計的記述です。
---
取引にはリスクが伴います。このインジケーターはテクニカル分析ツールです — 常に適切なリスク管理を適用してください。


