
Descripción
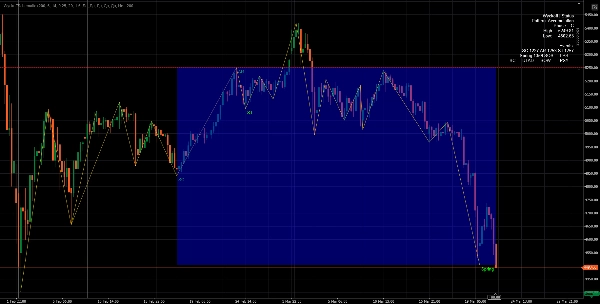
El Indicador Esquemático Wyckoff es una herramienta profesional de estructura de mercado diseñada para detectar y visualizar automáticamente las fases de acumulación y distribución Wyckoff directamente en el gráfico.
Construido sobre los principios del Método Wyckoff, este indicador identifica eventos institucionales clave como Clímax de Venta (SC), Rally Automático (AR), Spring, Señal de Fortaleza (SOS), Clímax de Compra (BC), Upthrust (UTAD) y más, ayudando a los traders a entender el comportamiento del dinero inteligente en tiempo real.
A diferencia de los indicadores tradicionales, esta herramienta no se basa en señales rezagadas sino que se enfoca en estructura de precios, comportamiento del volumen y volatilidad, proporcionando una visión más profunda de la dinámica del mercado.
Concepto Central
El indicador se basa en la idea de que los mercados se mueven a través de ciclos estructurados:
- Acumulación → Incremento → Distribución → Decremento
Detecta y visualiza automáticamente:
- Rangos de mercado
- Fases Wyckoff (A–E)
- Eventos institucionales clave
- Rupturas estructurales y falsas rupturas
Características Clave
1. Detección Automática de Fases Wyckoff
El indicador identifica todas las fases principales del ciclo Wyckoff:
- Fase A – Detención de la tendencia
- Fase B – Construcción de una causa (formación de rango)
- Fase C – Spring / UTAD (falsa ruptura)
- Fase D – Confirmación de tendencia (SOS / SOW)
- Fase E – Continuación de la tendencia
Cada fase se resalta visualmente con colores personalizables para un reconocimiento instantáneo.
2. Reconocimiento Inteligente de Eventos
El sistema detecta eventos críticos de Wyckoff:
Acumulación:
- SC – Clímax de Venta
- AR – Rally Automático
- ST – Prueba Secundaria
- Spring – Falsa ruptura a la baja
- SOS – Señal de Fortaleza
- LPS – Último Punto de Soporte
Distribución:
- BC – Clímax de Compra
- AR – Reacción Automática
- ST – Prueba Secundaria
- UTAD – Upthrust Después de Distribución
- SOW – Señal de Debilidad
- LPSY – Último Punto de Suministro
Estos eventos se trazan directamente en el gráfico con etiquetas.
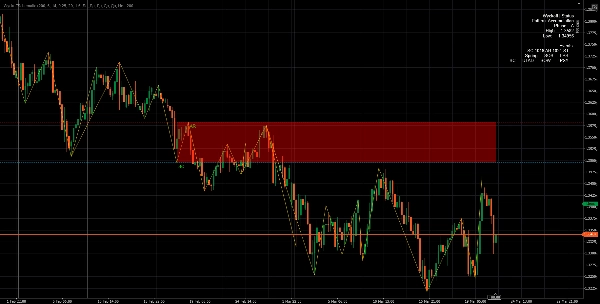
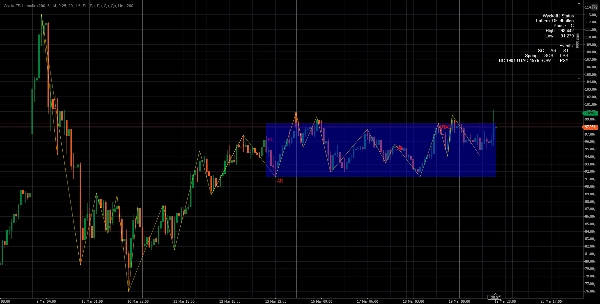
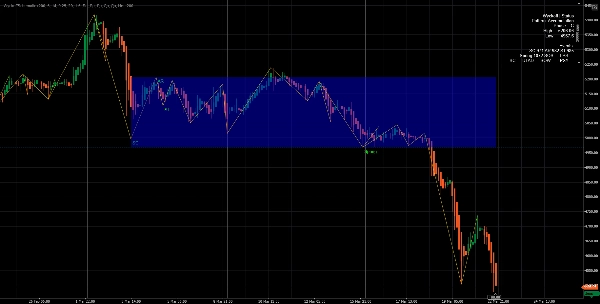
3. Detección Adaptativa de Rangos
El indicador construye y actualiza dinámicamente los rangos de trading:
- Detecta automáticamente máximos y mínimos del rango
- Ajusta los límites usando tolerancia basada en ATR
- Muestra zonas de soporte y resistencia
Esto permite a los traders ver claramente dónde el mercado está acumulando o distribuyendo.
4. Motor de Estructura ZigZag
Un sistema ZigZag basado en pivotes incorporado:
- Filtra el ruido del mercado
- Resalta máximos y mínimos estructurales verdaderos
- Garantiza un reconocimiento preciso de patrones
Esto es esencial para identificar estructuras Wyckoff de manera confiable.
5. Integración de Volumen y Volatilidad
El indicador utiliza:
- Media Móvil de Volumen
- Detección de Picos de Volumen
- ATR (Rango Verdadero Promedio)
Esto le permite:
- Confirmar actividad institucional
- Filtrar señales falsas
- Mejorar la precisión de eventos como SC, BC, Spring, UTAD
6. Lógica de Máquina de Estados en Tiempo Real
En su núcleo, el indicador ejecuta un algoritmo de máquina de estados que:
- Rastrea la evolución de la estructura del mercado
- Transiciones entre fases (A → E)
- Evita señales duplicadas
- Mantiene el contexto (Acumulación vs Distribución)
7. Componentes Visuales
El indicador proporciona un conjunto completo de herramientas visuales:
- ✔ Cajas de resaltado de fases
- ✔ Líneas de máximos/mínimos del rango
- ✔ Líneas de estructura ZigZag
- ✔ Etiquetas de eventos en el gráfico
- ✔ Panel de estado en tiempo real
8. Panel de Estado (Información del Mercado en Vivo)
Un panel incorporado muestra:
- Patrón actual (Acumulación / Distribución)
- Fase actual (A–E)
- Límites del rango
- Eventos detectados
Esto brinda a los traders una visión instantánea de las condiciones del mercado.
9. Sistema de Alertas
Alertas emergentes opcionales te notifican cuando ocurren eventos clave:
- SC, BC, Spring, UTAD, SOS, SOW, etc.
Perfecto para monitorear múltiples mercados.
Ventajas
✔ Perspectiva del Dinero Inteligente
A diferencia de los indicadores comunes, esta herramienta sigue la lógica institucional, no indicadores minoristas.
✔ Detección Temprana de Señales
Identifica acumulación/distribución antes de rupturas, permitiendo:
- Entradas tempranas
- Mejores configuraciones de riesgo/recompensa
✔ Reducción de Ruido
Usando pivotes, ATR y filtros de volumen, el indicador evita:
- Señales aleatorias
- Ruido del mercado
- Falsas rupturas
✔ Análisis Wyckoff Totalmente Automatizado
No es necesario marcar manualmente:
- Fases
- Eventos
- Rangos
Todo se detecta automáticamente.
✔ Altamente Personalizable
Puedes ajustar:
- Periodo de retroceso
- Sensibilidad de pivote
- Tolerancia ATR
- Sensibilidad de volumen
- Elementos visuales (etiquetas, cajas, líneas)
✔ Optimizado para Rendimiento
- Usa análisis de ventana deslizante
- Limita objetos de dibujo
- Eficiente para trading en tiempo real
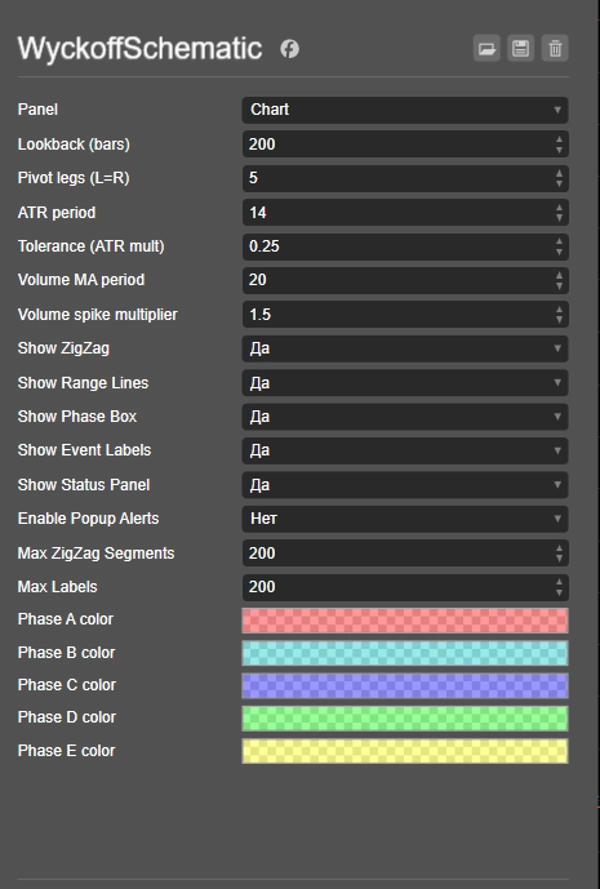
Parámetros de Entrada
Estructura y Sensibilidad
- Barras de Retroceso – rango de análisis
- Piernas de Pivote – sensibilidad de detección de oscilaciones
Volatilidad y Tolerancia
- Periodo ATR
- Multiplicador ATR (Tolerancia)
Análisis de Volumen
- Periodo MA de Volumen
- Multiplicador de Picos de Volumen
Visualización
- Mostrar ZigZag
- Mostrar Líneas de Rango
- Mostrar Caja de Fase
- Mostrar Etiquetas de Eventos
- Mostrar Panel de Estado
Alertas
- Habilitar notificaciones emergentes
Cómo Funciona (Simplificado)
- Detecta máximos/mínimos de pivote (estructura de mercado)
- Determina el contexto de la tendencia (alcista / bajista)
- Busca picos de volumen + condiciones estructurales
- Inicializa el patrón Wyckoff (Acumulación/Distribución)
- Rastrea eventos y fases paso a paso
- Actualiza visuales del gráfico en tiempo real
Mejores Casos de Uso
- Trading de dinero inteligente / Wyckoff
- Trading de rupturas
- Trading en rangos
- Detección de reversión
- Análisis de flujo de órdenes institucionales
Conclusión
El Indicador Esquemático Wyckoff es una herramienta analítica poderosa que transforma la compleja teoría Wyckoff en un sistema de trading totalmente automatizado, visual y accionable.
Permite a los traders:
- Entender la intención del mercado
- Identificar configuraciones de alta probabilidad
- Operar en alineación con el comportamiento institucional
Resumen
Valoraciones de clientes
5 | 100 % | |
4 | 0 % | |
3 | 0 % | |
2 | 0 % | |
1 | 0 % |


![Logotipo de "[CB] Pivot Points Pro"](https://cdn.ctrader.com/image/webp/43463c82-67b0-4f10-a4ba-901bba091d81_32594)


