

Descripción
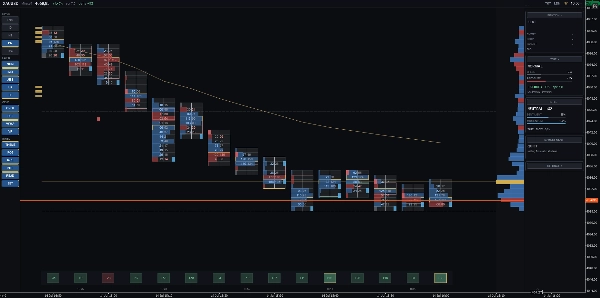
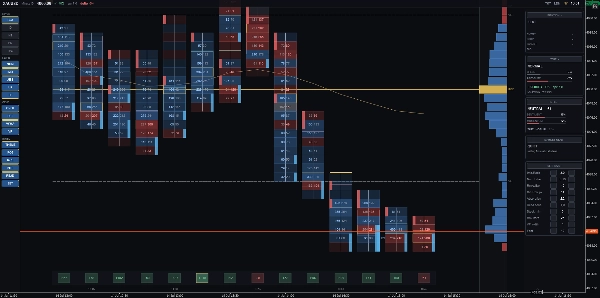
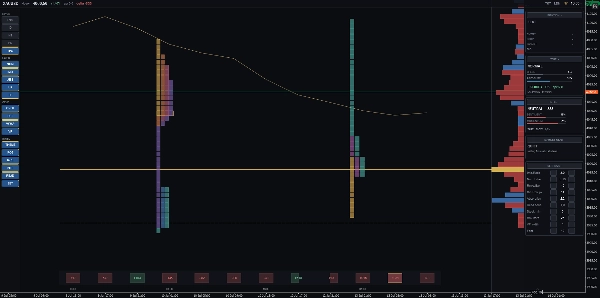
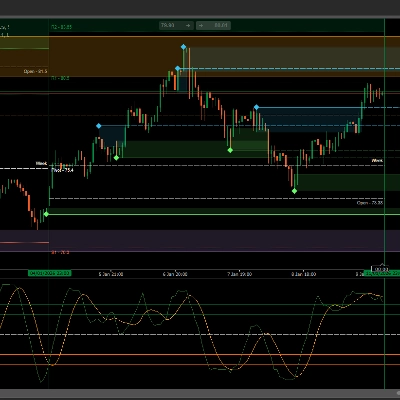
DRX OrderFlux convierte los datos de ticks en un gráfico limpio de flujo de órdenes, mostrando dónde se detiene el impulso y qué niveles la subasta prueba repetidamente. LO QUE DIBUJA - Huella Bid x Ask: Dividida en niveles de precio con actividad de compra y venta lado a lado. Cinco vistas: Bid x Ask, Delta, Heatmap, Perfil y TPO. - Desequilibrios y muros apilados: Resalta niveles de precio donde el desequilibrio de volumen excede la proporción elegida. - Absorción y subastas incompletas: Detecta alta actividad que no logra empujar el precio más allá, así como niveles extremos que cierran incompletos. - Impresiones únicas: Resalta niveles de precio visitados brevemente antes de rechazos rápidos. - Perfil de volumen: Mostrado en un panel fijado al borde derecho con POC, VAH, VAL y VWAP de sesión. - Bloques de tiempo TPO: Un perfil por sesión con POC dedicado, codificado por colores cronológicamente. - Carril Delta: Posicionado a lo largo de la parte inferior en una sola alineación para comparación directa. - Lectura de mercado: Señales discretas que aparecen durante rechazos claros o rupturas de volumen. Los umbrales se calibran automáticamente por símbolo. - Panel de cinta: Mide la velocidad actual de la cinta contra niveles promedio y proporciona advertencias de liquidez. - Panel de posición: Muestra entrada, stop, objetivo, PnL y relación Riesgo-Recompensa con líneas claras en el gráfico. La configuración del diseño se guarda automáticamente por símbolo y marco temporal. CÓMO USARLO Compatible con todos los símbolos y marcos temporales. Ideal para análisis intradía (M1 a H1). Funciona junto con DRX Footprint Lower para paneles dedicados de volumen, delta y delta acumulado. SOBRE LOS DATOS Los datos de ticks de cTrader incluyen tiempo, cotizaciones de bid y ask, pero no transmiten datos de tamaño de operación. DRX OrderFlux mide la actividad de ticks en lugar del volumen de contratos negociados, siguiendo la metodología estándar de volumen de ticks FX. Los datos de profundidad de mercado dependen de las fuentes del corredor. La mayoría de las cuentas CFD proporcionan niveles agregados limitados; por lo tanto, las advertencias de liquidez están integradas en el panel de cinta en lugar de una escalera de libro de órdenes.
Resumen
Key features include five distinct views: Bid x Ask footprint, Delta, Heatmap, Volume Profile, and TPO (Time Price Opportunity). The indicator highlights imbalances and stacked walls where one side dominates, absorption zones where heavy activity fails to move price, unfinished auctions, and single prints—levels touched only once. The volume profile panel shows POC (Point of Control), VAH (Value Area High), VAL (Value Area Low), and session VWAP. TPO profiles per session are color-coded to compare auction shapes across days.
Additional tools include a delta lane for comparing bars, a market read panel that signals price rejections or breaks with volume and delta confirmation, a tape panel showing tape speed and liquidity warnings, and a position panel displaying entry, stop, target, PnL, pips, and risk-reward ratio. Layouts are saved per symbol and timeframe for consistent workspace setup.
DRXFootprint uses cTrader tick data, measuring tick activity rather than traded contract volume, and includes liquidity warnings based on broker depth of market data.
Valoraciones de clientes
Conversación
Preguntas frecuentes
















Precio
