present
سجل واحصل على خصم 50 دولارًا على مشترياتك الأولى
Trading product for HCapitalFisherTransform مؤشر Market Structure Supply & Demand, image 1
HCapitalFisherTransform
مؤشر
20 التنزيلات
الإصدار 1.0، Aug 2026
Windows, Mac
5.0
التقييمات: 2
Trading product for HCapitalFisherTransform مؤشر Market Structure Supply & Demand, image 2
Trading product for HCapitalFisherTransform مؤشر Market Structure Supply & Demand, image 3
Trading product for HCapitalFisherTransform مؤشر Market Structure Supply & Demand, image 4
منذ 09/03/2026
5.78M
حجم التداول
263.72K
الربح بالبيب
1
المبيعات
342
التثبيتات المجانية

الوصف

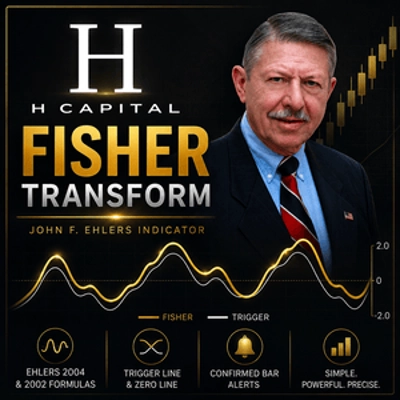
تحويل فيشر H Capital هو تنفيذ مجاني لـ cTrader لتحويل فيشر الذي طوره جون ف. إهليرز.

يقيس المؤشر موقع السعر ضمن نطاقه الأخير، ثم يطبق التحويل الرياضي لفيشر لتضخيم القيم بالقرب من الأطراف العليا والسفلى. هذا ينتج القمم والقيعان الحادة التي يُعرف بها تحويل فيشر ويمكن أن يجعل التغيرات في اتجاه السوق على المدى القصير أسهل في الرؤية.

تم بناء هذا الإصدار مع التركيز على دقة الصيغة، الشفافية، والبساطة بدلاً من إضافة ميزات غير ضرورية أو وعد بنتائج تداول غير واقعية.

المتضمن

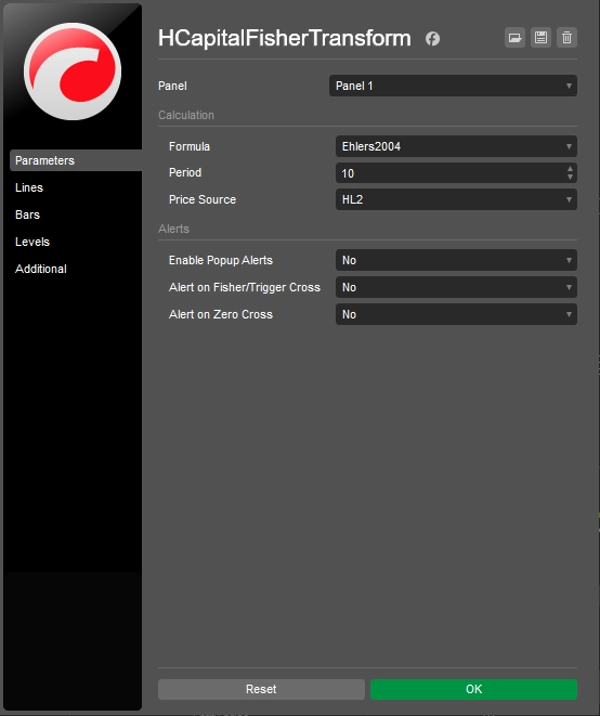
  • صيغة إهليرز 2004 — الصيغة الأحدث المستخدمة كإعداد افتراضي.
  • صيغة إهليرز 2002 — النسخة الأصلية المنشورة والمتاحة كخيار اختياري.
  • فترة النظر القابلة للتعديل.
  • خيارات متعددة لمصدر السعر.
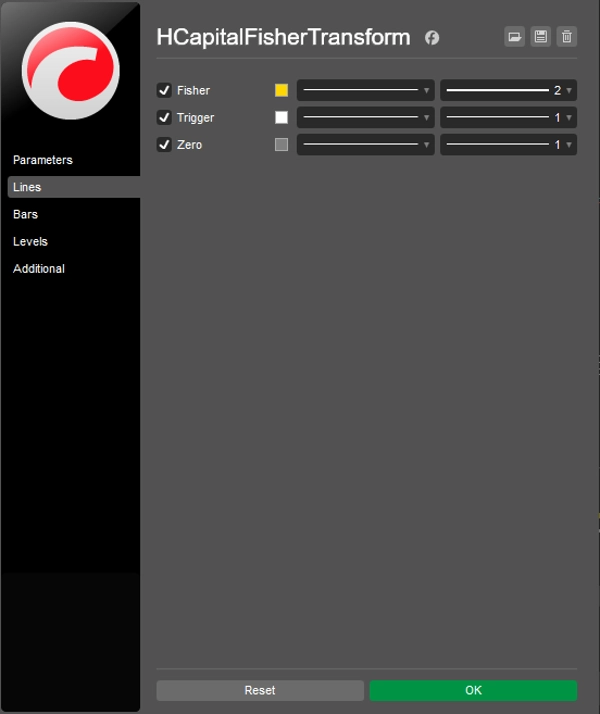
  • خط فيشر.
  • خط الزناد.
  • خط المرجع الصفري.
  • تنبيهات اختيارية لتقاطع فيشر/الزناد.
  • تنبيهات اختيارية لتقاطع الصفر.
  • تنبيهات بناءً على أشرطة مغلقة مؤكدة.
  • سلسلة إخراج عامة لتكامل مستقبلي مع cBot أو مؤشرات أخرى.
  • لا توجد حسابات لأشرطة مستقبلية أو منطق التطلع للأمام.

كيفية قراءته

تشير قيمة فيشر الصاعدة إلى أن السعر يتحرك نحو الجزء العلوي من نطاقه الأخير.

تشير قيمة فيشر الهابطة إلى أن السعر يتحرك نحو الجزء السفلي من نطاقه الأخير.

الزناد هو قيمة فيشر السابقة. لذلك، يبرز التقاطع تغيرًا في الاتجاه قصير الأجل لخط فيشر.

القراءات الإيجابية أو السلبية الكبيرة تظهر أن السعر قريب من طرف من نطاقه الأخير. يجب عدم تفسيرها تلقائيًا كإشارات شراء أو بيع.

يمكن أن يحافظ الاتجاه القوي على فيشر عند طرف لفترة ممتدة، وقد ينتج المؤشر انعطافات خاطئة خلال ظروف السوق المتجهة أو المتقلبة.

لهذا السبب، يكون فيشر عمومًا أكثر فائدة كـ أداة تحليل السوق والتأكيد بدلاً من نظام تداول مستقل.

نهج H Capital

هذا المؤشر هو جزء من مشروع H Capital للبحث في مؤشرات التداول المعروفة، وفهم الرياضيات والأدلة وراءها، وإعادة بناء أدوات مفيدة لـ cTrader، وجعلها متاحة مجانًا.

لا معدلات فوز مدعاة.
لا منطق مخفي.
لا جدار دفع.

ابحث عنه. ابنيه. اختبره. شاركه.

يتم توفير هذا المؤشر لأغراض البحث والتعليم ولا يضمن نتائج تداول مربحة.

الملخص

AI summary
H Capital Fisher Transform is a cTrader indicator implementing the Fisher Transform developed by John F. Ehlers. It measures price position within its recent range and applies a mathematical transformation to highlight sharp peaks and troughs, aiding visualization of short-term market direction changes. The indicator includes two calculation modes based on Ehlers' 2002 and 2004 formulas, with the 2004 version as default. Key features include an adjustable lookback period, multiple price-source options, Fisher line, trigger line (previous Fisher value), zero reference line, and optional alerts for Fisher/Trigger crossovers and zero-line crossings. Alerts are triggered only on confirmed closed bars. The indicator outputs public data series for integration with other cTrader bots or indicators and avoids future-bar or look-ahead calculations. Rising Fisher values indicate price moving toward the upper range, while falling values indicate movement toward the lower range. Crossovers between Fisher and trigger lines signal short-term directional changes. Large extreme readings reflect price near range limits but are not standalone buy or sell signals. This tool is intended primarily for market analysis and confirmation rather than as a sole trading system. It is part of the H Capital project focused on transparent, accurate, and simple implementations of established indicators for research and educational use.
ملف تعريف المؤشر
فئة المؤشر
الزخم
نوع المخرجات
التصور
الإشارات
متطلبات البيانات
أعمدة السعر فقط
الإشارات المدعومة
قوة الاتجاه

تقييمات العملاء

5.0
التقييمات: 2
5
100 %
4
0 %
3
0 %
2
0 %
1
0 %
تقييمات العملاء
October 11, 2026
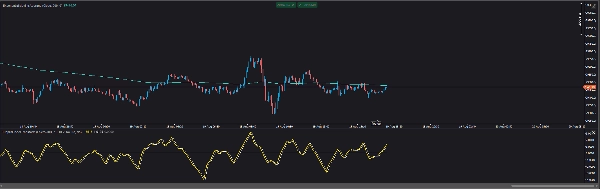
Clean and focused Fisher Transform implementation. Fisher, Trigger and zero reference rendered consistently on EURUSD and XAUUSD across H1 and M1, with stable historical output and no visible chart issues. The product is appropriately presented as an analysis tool rather than a trading system, with no exaggerated performance claims.
October 3, 2026

مناقشة

الأسئلة الشائعة

Market Structure
Supply & Demand
Liquidity Grab
يتم توفير المنتجات المتاحة من خلال cTrader Store، بما في ذلك روبوتات التداول والمؤشرات والإضافات، من قبل مطوري الطرف الثالث وإتاحتها لأغراض الوصول المعلوماتي والفني فقط. cTrader Store ليس وسيطًا ولا يقدم نصائح استثمارية أو توصيات شخصية أو أي ضمان للأداء المستقبلي.

المزيد من هذا المؤلف
مؤشر
Grid
Prop
+4
A free institutional-style chart tool that maps key daily liquidity levels in a clean H Capital interface.
cBot
Prop Firm Fit
One-click Trading
+3
Watches your equity in real time and blocks new trades the moment you're near your daily or max loss limit.

قد يعجبك أيضًا

مؤشر
Key Levels
Support & Resistance
Clean psychological round-number grid with native pip and point auto-scaling across Forex, Gold, Indices, and Crypto.
مؤشر
Imbalance
Key Levels
+4
This indicator combines Multi-Timeframe Liquidity tracking, a dynamic Fair Value Gap (FVG) and a 50% Daily Range
مؤشر
Prop
Forex
+13
Identifies market compression zones and explosive Breakout moments using mathematical modeling.
مؤشر
ATR
RSI
+5
Binary Options Signals Pro – Precision Trading at Your Fingertips
مؤشر
ZigZag Pro DEMO – Multi-Swing Indicator for cTrader DEMO VERSION – 24 hours free trial! This is a DEMO version of the Z
مؤشر
ADX
ATR
+5
Configure, simulate, and analyze trading strategies with custom filters, multi-target exits, and detailed performance me
شعار "Zig-Zag Extremity Tracker"
الأعلى تقييمًا
4.6
(5)
$19
/
$30
مؤشر
RSI
Breakout
+1
Dynamically adjusts regression channels based on ZigZag extremes, resetting when price breaks bands to track real trends
مؤشر
ATR
RSI
+5
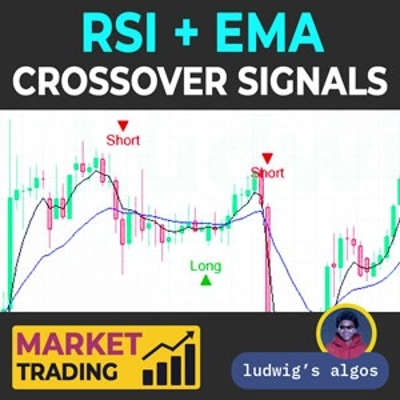
Dual confirmation RSI + EMA crossover signals with visual alerts and dynamic ATR offsets.
مؤشر
Risk Dashboard
AI-powered daily range forecasts help traders spot volatility opportunities and plan stops and targets.
شعار "ATR Bands"
مشهور
4.7
(4)
$19
مؤشر
ATR
Prop
+13
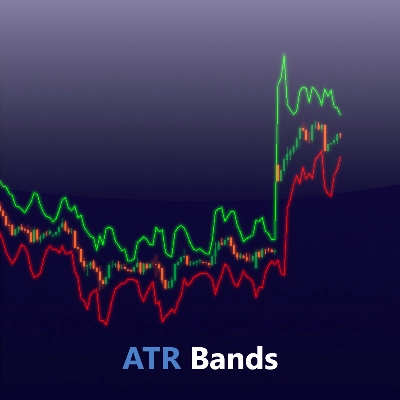
Enhance trading with ATR Bands! Visualize market volatility using dynamic upper and lower ATR bands for precise decision
شعار "ORB v1"
مشهور
5.0
(3)
$19
مؤشر
Breakout
Opening Range Breakout (ORB) - Visual Edition
شعار "Index Hunter"
الأعلى تقييمًا
4.7
(4)
$20
/
$40
مؤشر
AI
ATR
+9
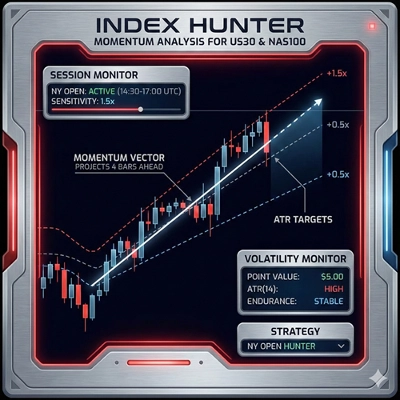
Index Hunter: Momentum analysis for US30 & NAS100. Designed to identify high-velocity moves and intraday trends.
مؤشر
Order Block
Breaker Block
+5
Unicorn Model ICT Indicator — Smart Trading with Precision
شعار "VegaXLR - Fibonacci Bands"
الأعلى تقييمًا
4.5
(4)
من 10$
مؤشر
Forex
Customizable Dynamic Fibonacci Channels and Smart Alerts
مؤشر
Drawdown Monitor
Protect your funded account. Real-time Daily Equity Drawdown monitor with Green / Orange / Red flashing alerts.
مؤشر
ATR
RSI
+1
Super Trend Rsi ,ATR + trend change distance + dynamic Alpha, divergence/convergence
مؤشر
Prop
Forex
+4
A comprehensive workflow‑enhancement toolkit designed to make charting on cTrader smoother, clearer, and more efficient.
مؤشر
ATR
Wedge
+2
Strong Supertrend Turn Market Movement into a Clear Map Market analysis

السعر

منذ 09/03/2026
5.78M
حجم التداول
263.72K
الربح بالبيب
1
المبيعات
342
التثبيتات المجانية