
H Capital Liquidity Map Lite V1
Wskaźnik
326 pobrania
Wersja 1.0, Mar 2026
Windows, Mac

Od 09/03/2026
5.83M
Wolumen transakcji
263.72K
Zysk w pipsach
1
Sprzedaż
349
Bezpłatne instalacje
Opis
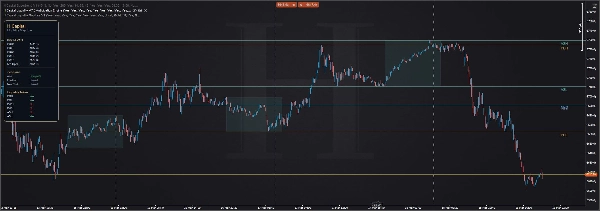
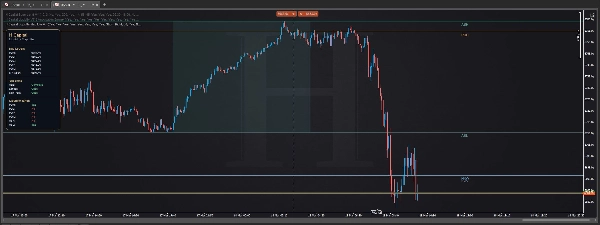
H Capital Liquidity Map Lite to darmowe narzędzie do tworzenia wykresów zaprojektowane dla traderów, którzy chcą mieć strukturę bez bałaganu.
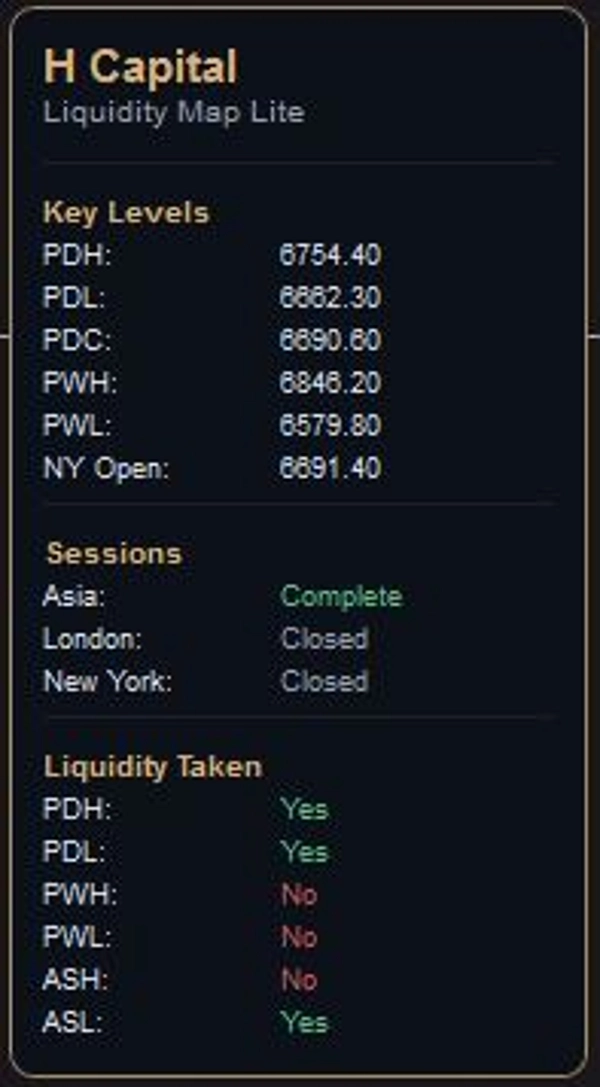
Mapuje kluczowe odniesienia rynkowe, które wielu traderów monitoruje codziennie:
- maksimum poprzedniego dnia
- minimum poprzedniego dnia
- zamknięcie poprzedniego dnia
- maksimum poprzedniego tygodnia
- minimum poprzedniego tygodnia
- otwarcie Nowego Jorku
- zakres sesji azjatyckiej
- status pobranej płynności
Cel jest prosty: dać traderom czyste ramy przed wykonaniem transakcji.
Zamiast zalewać wykres sygnałami, H Capital Liquidity Map Lite koncentruje się na poziomach i odniesieniach sesji, które pomagają budować kontekst. Interfejs został zaprojektowany w stylu premium minimalistycznym, aby wykres pozostał czytelny, a informacje były dostępne na pierwszy rzut oka.
Najlepsze dla:
- traderów indeksów
- traderów forex
- traderów metali
- traderów opierających się na płynności
- traderów preferujących czyste wykresy
Co robi:
- mapuje kluczowe dzienne i tygodniowe poziomy płynności
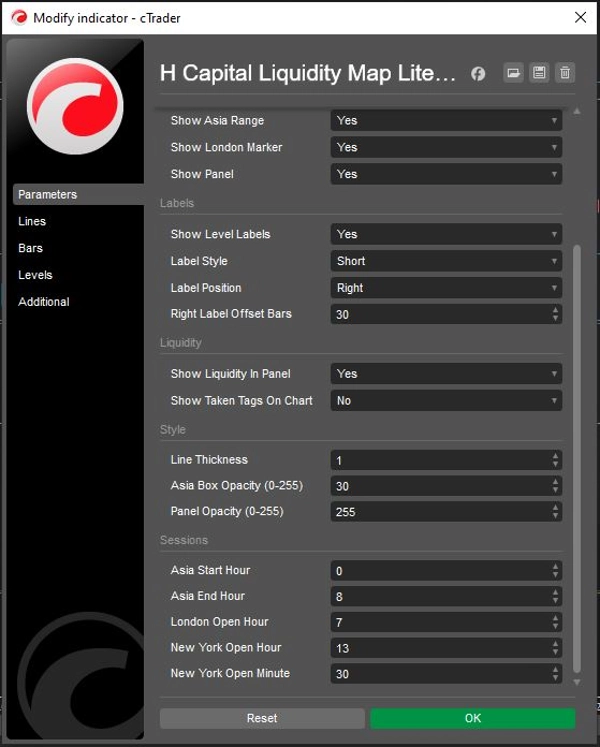
- wyświetla strukturę sesji
- śledzi, czy ważne poziomy zostały osiągnięte
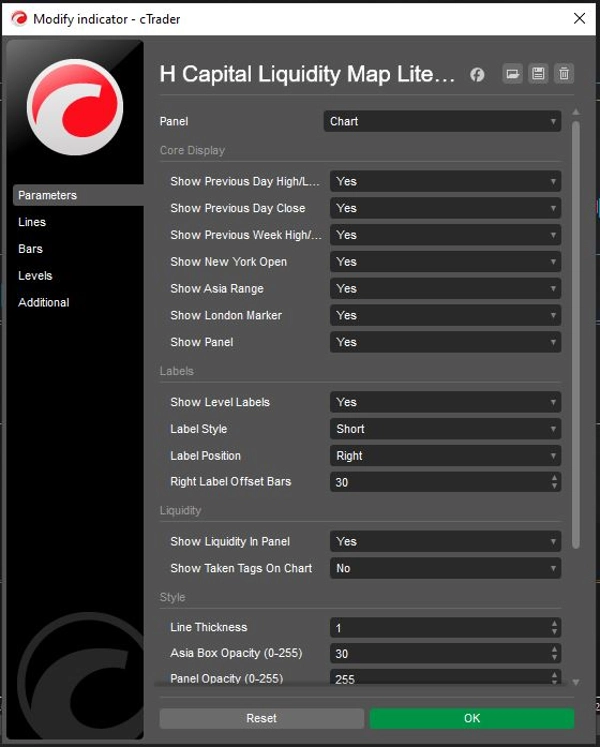
- utrzymuje informacje zorganizowane poprzez panel premium na wykresie
Czego nie robi:
- nie generuje sygnałów kupna/sprzedaży
- nie zastępuje osądu wykonawczego
- nie działa jako silnik alertów
To nie jest narzędzie sygnałowe. To profesjonalna mapa rynku.
Podsumowanie
Podsumowanie AI
H Capital Liquidity Map Lite is a charting tool designed to provide traders with a clear, uncluttered view of key daily and weekly liquidity levels. It displays important market references such as the previous day’s high, low, and close; previous week’s high and low; New York open; Asia session range; and liquidity taken status. The tool organizes this information within a minimalist, premium on-chart panel to maintain readability and quick accessibility.
This indicator is suited for traders in indices, forex, metals, and those focusing on liquidity-based strategies who prefer clean chart layouts. It helps build market context by mapping session structures and tracking whether significant levels have been breached. The tool does not generate buy or sell signals, replace execution judgment, or function as an alert system. Instead, it serves as a professional market map to support informed trading decisions.
This indicator is suited for traders in indices, forex, metals, and those focusing on liquidity-based strategies who prefer clean chart layouts. It helps build market context by mapping session structures and tracking whether significant levels have been breached. The tool does not generate buy or sell signals, replace execution judgment, or function as an alert system. Instead, it serves as a professional market map to support informed trading decisions.
Profil wskaźnika
Dyskusja
Opinie klientów
0.0
Opinie: 0
Opinie klientów
Ten produkt nie ma jeszcze opinii. Wypróbowałeś(-aś) go już? Bądź pierwszy(-a) i powiedz o tym innym!
Częste pytania
Prop
Forex
Indices
Commodities
Crypto
Grid
Produkty dostępne za pośrednictwem cTrader Store, w tym boty handlowe, wskaźniki i wtyczki, dostarczane są przez deweloperów zewnętrznych i udostępniane wyłącznie w celach informacyjnych oraz w celu zapewnienia dostępu technicznego. cTrader Store nie jest brokerem i nie zapewnia doradztwa inwestycyjnego, nie udziela spersonalizowanych rekomendacji ani nie gwarantuje przyszłych wyników.
Więcej od tego autora










Cena
Od 09/03/2026
5.83M
Wolumen transakcji
263.72K
Zysk w pipsach
1
Sprzedaż
349
Bezpłatne instalacje