
dark-cloud
Indicador
182 descargas
Versión 1.0, Mar 2025
Windows, Mac
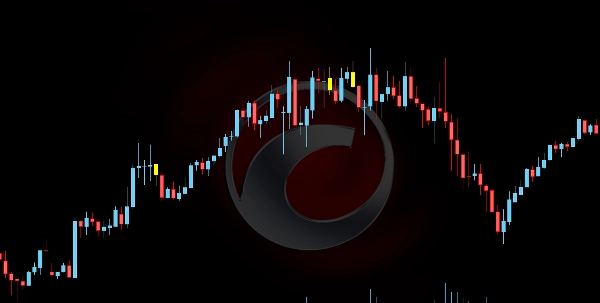
El indicador Dark Cloud Cover es una herramienta de análisis técnico diseñada para identificar posibles patrones de reversión bajista en el mercado. Este patrón consta de dos velas consecutivas:
- Una vela alcista (verde) que señala un fuerte impulso de compra.
- Una vela bajista (roja) que abre por encima del cierre anterior pero cierra por debajo del punto medio de la vela previa, indicando presión de venta.
Esta formación sugiere un posible cambio en el sentimiento del mercado, donde los compradores pierden el control y los vendedores toman el mando.
Características y Funcionalidad:
- Detección de Patrones:
-
- El indicador escanea el patrón Dark Cloud Cover basado en la acción del precio de las velas.
- Cuando se detecta, resalta visualmente el patrón para alertar a los traders.
- Filtro de Tendencia (Opcional):
-
- Para mejorar la precisión, el indicador incluye un filtro de tendencia opcional usando una Media Móvil (MA).
- Si está habilitado, el patrón solo se considera válido cuando ocurre en una tendencia alcista.
- Lógica de Confirmación:
-
- El indicador puede validar la señal bajista verificando la siguiente vela.
- Se identifica una vela de confirmación si cierra por debajo del mínimo del Dark Cloud Cover y tiene un volumen de ticks mayor que el promedio de las velas recientes.
- Esto asegura una mayor fiabilidad de la señal.
- Marcadores Visuales:
-
- Velas Amarillas: Marcan el patrón detectado Dark Cloud Cover.
- Velas Naranjas: Resaltan la vela de confirmación si se cumplen las condiciones de volumen.
Este indicador ayuda a los traders a identificar configuraciones de reversión de alta probabilidad, mejorando la toma de decisiones para entradas cortas o estrategias de gestión de riesgo.
Perfil del indicador
0.0
Valoraciones: 0
Valoraciones de clientes
Este producto todavía no se ha valorado. ¿Ya lo ha probado? Sea el primero en informar a otros.
Signal
Los productos disponibles a través de cTrader Store, incluidos bots, indicadores y plugins para operar, son proporcionados por desarrolladores de terceros y están disponibles únicamente con fines informativos y de acceso técnico. cTrader Store no es un bróker, por lo que no proporciona asesoramiento de inversión, recomendaciones personales ni ninguna garantía de rentabilidad futura.
Más de este autor


5
Ventas
429
Instalaciones gratis