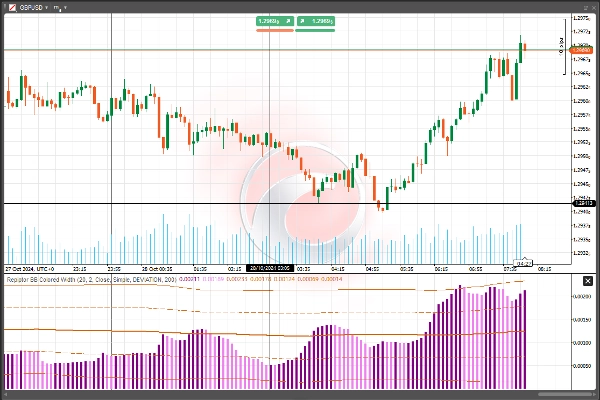
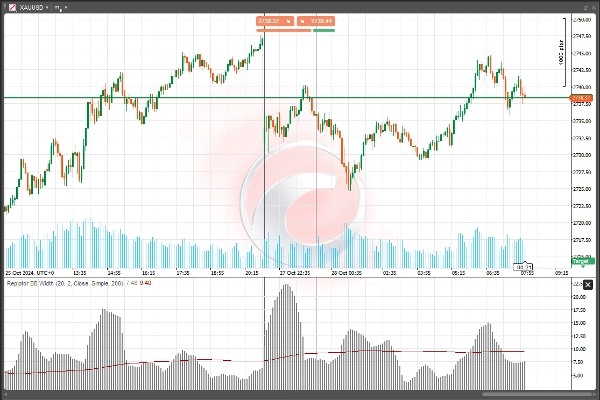
Courtiers & props
Pour entreprise
00
Days
:
00
Hours
:
00
Minutes
:
00
Seconds
Indicateur
Bollinger
Repiptor BB Width
03/09/2025
79
Desktop
Depuis le 26/10/2024
Installations gratuites
1013
Image mise en ligne de "Repiptor BB Width"Image mise en ligne de "Repiptor BB Width"

Bollinger Bands Width with dynamic average level

0.0
Avis : 0
Avis clients
Il n'y a pas encore d'avis sur ce produit. Vous l'avez déjà essayé ? Soyez le premier à en parler aux autres !
Plus de cet auteur
Repiptor Candlescope Lite
Candlestick pattern detector lite version
Repiptor RSI Amplified
RSI Amplified
Indicateur
Bollinger
Repiptor BB Colored Width
Colored Bollinger Bands Width
Vous pourriez aussi aimer
Indicateur
VWAP
Indices
RSI
+4
ProVWAP
Advanced Anchored VWAP for cTrader: volatility bands, real‑time alerts & customizable session resets.
Indicateur
ZigZag
VWAP
FVG
+4
Candle Volume Profile Demo
Candle Volume Profile for Crypto
Indicateur
Indices
RSI
XAUUSD
+7
RSI Divergence
Detects bullish and bearish divergences
Indicateur
RSI
Breakout
Supertrend
All Support and Resistance Levels
"Identify key market zones and visualize support/resistance from multiple timeframes on a single chart.
Indicateur
Indices
Breakout
Forex
+6
MGC Trend Analysis 1.4
Trend analysis, automatic analysis, position, swingtrader, scalper
Vishal Volume Profile v2.0
Volume Profile plots traded volume at each price level, highlighting high activity zones of precise support & resistance
Candle Timer & Strength Panel Demo -
Candle Timer & Strength Panel DEMO for cTrader DEMO VERSION – 24 hours free trial! This is a DEMO version of the Candle
Indicateur
NAS100
NZDUSD
XAUUSD
+10
Moving Average PRO
Customize your Moving Average! Choose any timeframe and price source for precision and flexibility in your analysis.
Indicateur
RSI
Breakout
Supertrend
Market Trend OB
Price action to detect when the market changes trend (MSB) and defines, order blocks , ZigZag etc.📊
Indicateur
NAS100
NZDUSD
RSI
+13
Multi Timeframe Trend Scanner
Multi Timeframe Trend Scanner 🔍 EMA+RSI+ATR heatmap with clear BUY/SELL bias from M5 up to D1.
VegaXLR - Chart Patterns Alerts
Enhance your trading strategy with automated detection and alerts for key chart patterns.
Indicateur
Indices
Stocks
Commodities
+2
Deviation-Scaled Moving Average
Momentum-adaptive MA: scales responsiveness via deviation — fast in trend, smooth in chop.
Indicateur
Breakout
Bollinger
Pressure Scanner
Pressure Scanner is a volatility-and-momentum to show both pressure states (squeeze on/off) and directional
Indicateur
NAS100
NZDUSD
Martingale
+25
Liquidity Cluster Order
Liquidity Cluster Order automatically detects and draws accumulation zones & distribution zones
Indicateur
Grid
NAS100
RSI
+18
QX SessionBox ORB
QX SessionBox ORB: Session boxes + ORB levels + clean dashboard with optional closed-candle breakout signals.
[Hamster-Coder] Pivot Points (Demo)
[Hamster-Coder] Pivot Points (Demo)
Indicateur
RSI
XAUUSD
Breakout
+5
BOS & CHOCH
Market structural patterns , specifically the concepts of Change of Character (ChoCH) 🔄 and Break of Structure (BoS) 💥