present
Inscrivez-vous et bénéficiez d'une remise de 50 $ sur votre premier achat
Trading product for Supply Demand Detector Indicateur Supply & Demand, image 1
Supply Demand Detector
Indicateur
Version 1.0, May 2026
Windows, Mac
Trading product for Supply Demand Detector Indicateur Supply & Demand, image 2
Trading product for Supply Demand Detector Indicateur Supply & Demand, image 3
Trading product for Supply Demand Detector Indicateur Supply & Demand, image 4
Depuis le 13/05/2026

Description

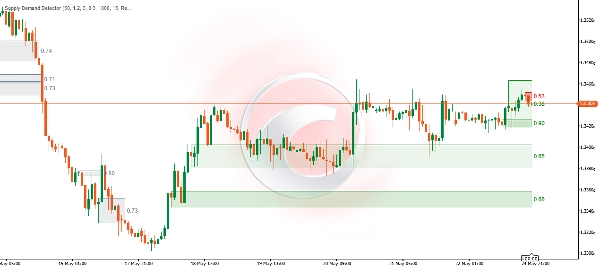
How the Supply & Demand Zone Detector works:

1. Impulse Detection (Finding Institutional Activity)

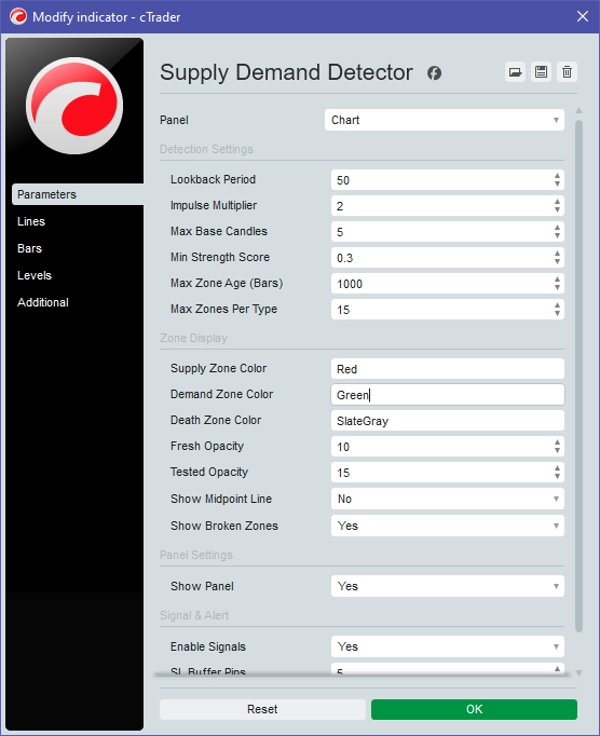
The algorithm continuously calculates the average body size of the last 50 candles (adjustable via Lookback Period). When it detects a candle that is significantly larger than this average (controlled by the Impulse Multiplier, default 1.2x), it flags it as an Impulse Candle.

  • Bullish Impulse: Indicates institutional buying. Forms a Demand Zone.
  • Bearish Impulse: Indicates institutional selling. Forms a Supply Zone.

2. Base Identification (Drawing the Zone)

Once an impulse is detected, the indicator looks backward to find a cluster of small candles (body size < 50% of the average) immediately preceding the impulse. These are the Base Candles.

  • The Top of the zone is the highest high of these base candles.
  • The Bottom of the zone is the lowest low of these base candles.

3. Strength Scoring

The indicator calculates a strength score (from 0.00 to 1.00) based on three factors:

  1. Impulse Size: How massive the breakout candle is.
  2. Post-Move: How far the price traveled immediately after the breakout.
  3. Base Density: Fewer base candles mean a faster, more aggressive institutional reaction (higher score).
    This score is printed inside the far-right edge of the zone box.

4. Zone Lifecycle & The "Death" Mechanic

As live price moves, the indicator updates the status of the zones in real-time:

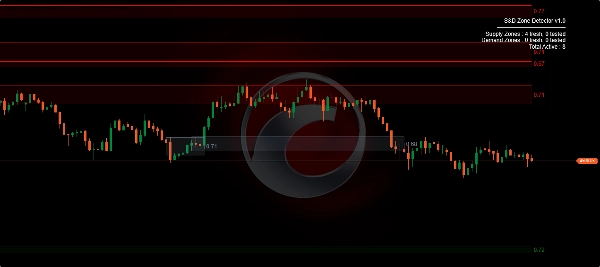
  • Fresh (Untouched): The zone is newly formed and highly valid. The box automatically stretches to the right, following the current live candle.
  • Tested: Price touches the zone but does not break it. Generates a Signal Arrow (Buy/Sell) on the chart.
  • Mitigated: Price penetrates more than 50% deep into the zone. The zone is weakening.
  • Broken (Death Zone): If a candle completely closes beyond the zone's opposite boundary (e.g., closes below a Demand Zone), the zone is invalidated.
    • The visual reaction: The zone immediately stops stretching to the right (anchored to the DeathTime), and its color turns into a faded Slate Gray (Death Color) to show it is no longer active.

5. Multi-Overlap Filter

To prevent the chart from becoming heavily cluttered, the indicator checks for overlapping zones. If a newly detected zone overlaps more than 70% with an existing older zone of the same type, the new zone is ignored.

Résumé

Profil de l'indicateur
Catégorie de l'indicateur
Structure du marché (SMC)
Type de résultat
Visualisation
Exigences en matière de données
Barres seulement
Signaux pris en charge
Inversion

Avis clients

0.0
Avis : 0
Avis clients
Il n'y a pas encore d'avis sur ce produit. Vous l'avez déjà essayé ? Soyez le premier à en parler aux autres !

Discussion

Questions fréquentes

Supply & Demand
Les produits disponibles sur cTrader Store, notamment les bots de trading, les indicateurs et les plug-ins, sont fournis par des développeurs tiers et mis à disposition à titre informatif et à des fins d'accès technique uniquement. cTrader Store n'est pas un courtier et ne fournit aucun conseil en investissement, aucune recommandation personnelle ni aucune garantie quant aux performances futures.

Plus de cet auteur

Indicateur
BOS
CHOCH
+3
Shows market structure (BoS/CHoCH) and key zones (OB/FVG) to help traders spot high-probability trade setups.
Indicateur
Risk Dashboard
AI-powered daily range forecasts help traders spot volatility opportunities and plan stops and targets.

Vous pourriez aussi aimer

Indicateur
VWAP
Volume
+3
Don't trust static support and resistance levels, this indicator combines Fibonacci and VWAP in one powerful tool.
Indicateur
ADX
ATR
+5
Range-filter BUY/SELL flips with an ATR or swing stop, three targets, five confluence stars and a live panel
Indicateur
Forex
Crypto
+5
The best filter for trading trend continuations on Renko charts.
Indicateur
Key Levels
Order Block
+5
Order blocks, fair value gaps, liquidity sweeps and a 24-timeframe signal scanner on one chart.
Indicateur
MACD
some user add moving average to macd to see better. in ctrader 4.3.11 there is a problem with this . I make a macd tha
Indicateur
RSI
BTCUSD
+5
Traders Dynamic Index (TDI) — Divergence Edition
Indicateur
ATR
RSI
+5
Multi-factor VWAP mean-reversion signals with ATR bands, volume exhaustion, and RSI gate on cTrader.
Indicateur
Doji
Volume
+5
Instantly spot high-liquidity institutional moves with clean, non-obtrusive triangle alerts on cTrader charts.
Indicateur
BOS
CHOCH
+3
Smart Money Concepts Pro v5.1 for cTrader is a structural market analysis indicator that identifies swings, BOS, CHoC
Indicateur
Shows BUY & SELL signals for 3 & 4 BAR PATTERN (Morning star/ Evening star). It is adjustable and it will SHOW ARROWS.
Indicateur
ATR
RSI
+16
This trading game allows you to explore and practice investment strategies in a real-time market data environment.
Logo de "PivotLevels"
Les mieux notés
4.7
(4)
$25
/
$30
Indicateur
Prop
Forex
+4
It draws Pivot Levels on the chart.
Logo de "Inside Candle"
Les mieux notés
4.5
(4)
$19
/
$20
Indicateur
ATR
RSI
+16
Highlight market consolidation zones instantly with this Inside Candle indicator — precise, clean, and powerful.
Indicateur
MACD
Prop
+14
Customize the MACD! Choose colors, get real-time tick updates, and see crossover points for enhanced trading precision.
Indicateur
CHOCH
Inducement
+5
TradeLens - Frame the Trade. Refine the Entry. Two Timeframes. One Decision.
Indicateur
Forex
BTCUSD
+11
Next-gen Volume Oscillator using Hyperbolic Tangent math. No repainting. Includes arrows, alerts, and overlay mode 🎯
Indicateur
Moving Average
Support & Resistance
Adaptive, low-lag moving average designed to smooth noise while responding quickly to changing market conditions.
Indicateur
ATR
Prop
+15
Initial Range – Where the open writes the script.

Prix

Depuis le 13/05/2026