
Description
SC Supports & Resistances
L’outil professionnel de support et résistance que tout trader devrait avoir
SC Supports & Resistances est un indicateur avancé d’action des prix conçu pour identifier, gérer et visualiser automatiquement des zones dynamiques de support et de résistance directement sur le graphique.
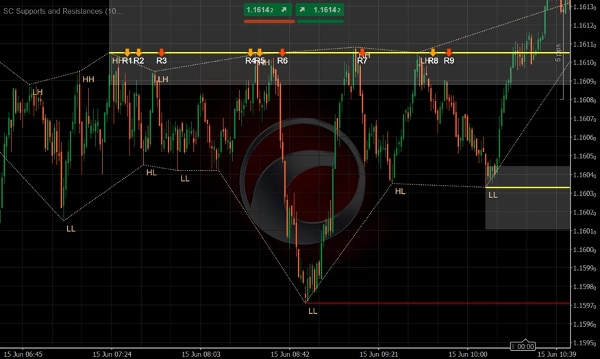
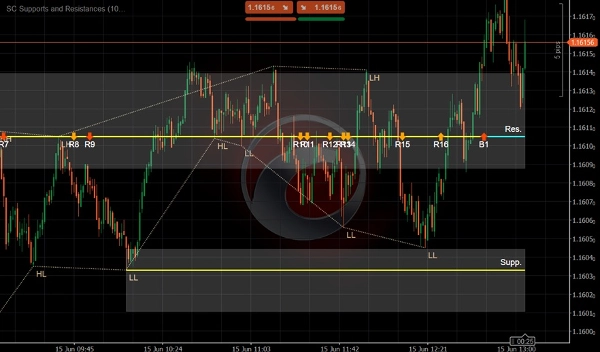
Contrairement aux outils traditionnels de support et résistance qui reposent sur de simples lignes horizontales, SC Supports & Resistances utilise des bandes adaptatives basées sur l’ATR pour représenter des zones de réaction du marché réalistes, aidant les traders à comprendre où le prix est le plus susceptible de rejeter, consolider ou franchir.
L’indicateur analyse en continu les oscillations du marché pour détecter des niveaux significatifs de support et de résistance, suit comment le prix interagit avec chaque zone au fil du temps, et classe automatiquement chaque réaction comme Rejet ou Cassure. Les réactions fortes sont mises en évidence séparément, permettant aux traders de distinguer immédiatement les tests mineurs des événements importants du marché.
En combinant une détection intelligente des niveaux, une gestion dynamique des zones et une analyse en temps réel des réactions, SC Supports & Resistances transforme le trading des supports et résistances en un processus objectif et mesurable.
Caractéristiques clés
✔ Détection automatique des zones significatives de support et de résistance
✔ Bandes dynamiques basées sur l’ATR qui s’adaptent à la volatilité du marché
✔ Identification automatique des Rejets et Cassures
✔ Détection des Rejets forts et des Cassures fortes
✔ Suivi en temps réel de la force des niveaux et des réactions du marché
✔ Reconnaissance intelligente des niveaux d’oscillation basée sur le comportement des prix
✔ Expiration automatique des niveaux obsolètes pour garder les graphiques propres
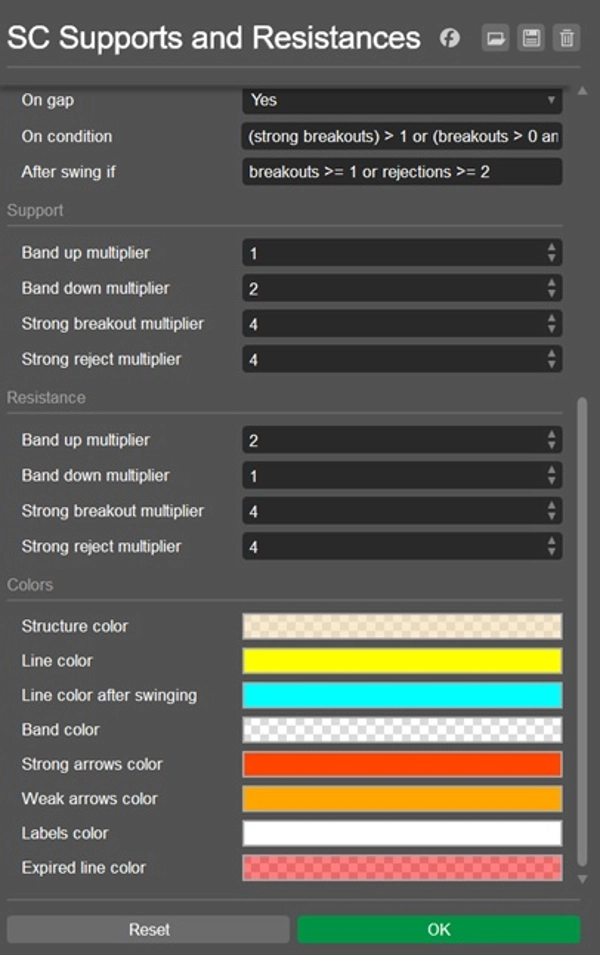
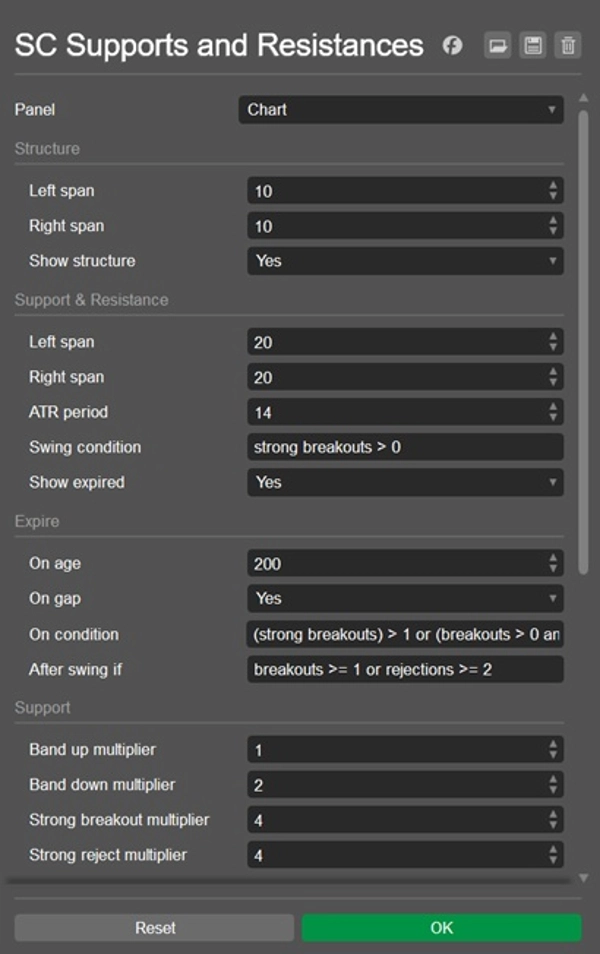
✔ Sensibilité et critères de réaction entièrement personnalisables
✔ Représentation visuelle claire avec bandes, flèches, étiquettes et statistiques
✔ Fonctionne sur tous les marchés et toutes les unités de temps
Intelligence avancée des niveaux
SC Supports & Resistances fait bien plus que simplement tracer des niveaux.
Chaque zone détectée évolue selon la manière dont le marché interagit avec elle. L’indicateur surveille en continu :
- Rejets
- Cassures
- Rejets forts
- Cassures fortes
- Âge du niveau
- Formation d’oscillation
Au fur et à mesure que les conditions du marché changent, les niveaux peuvent automatiquement gagner en importance, devenir des niveaux d’oscillation significatifs ou expirer lorsqu’ils ne sont plus pertinents.
Cela crée un cadre vivant de support et résistance qui reflète le comportement réel du marché plutôt que des lignes historiques statiques.
Bandes dynamiques au lieu de lignes uniques
Les marchés réagissent rarement à un prix exact.
Pour cette raison, SC Supports & Resistances représente chaque niveau comme une zone de prix dynamique, dont la taille s’adapte automatiquement à la volatilité via des calculs ATR.
Cela offre une représentation plus réaliste des zones d’offre et de demande tout en réduisant les faux signaux générés par des pénétrations de prix insignifiantes.
Le résultat est une vue plus claire et plus précise des endroits où les participants au marché défendent réellement le prix.
Signaux de trading basés sur les réactions
Chaque interaction avec une zone de support ou de résistance est évaluée en temps réel.
Lorsque le prix rejette une zone, l’indicateur génère des signaux directionnels clairs. Lorsque le prix franchit avec succès un niveau, des signaux de cassure sont générés et classés selon leur force.
Cela permet aux traders d’identifier instantanément :
- Des opportunités potentielles de retournement
- Des configurations de continuation de tendance
- Des confirmations de cassure
- Des tentatives de cassure échouées
- Des zones de réaction institutionnelles à fort intérêt
Gestion automatique du cycle de vie des niveaux
L’un des plus grands défis dans le trading des supports et résistances est de déterminer quand un niveau n’est plus pertinent.
SC Supports & Resistances gère automatiquement tout le cycle de vie de chaque niveau grâce à une logique d’expiration intelligente basée sur :
- L’inactivité du marché
- Les gaps de prix
- Le comportement lors des cassures
- Le comportement lors des rejets
- La logique de confirmation des oscillations
Le résultat est un graphique qui reste concentré uniquement sur les niveaux qui comptent encore, éliminant le désordre inutile et les informations obsolètes.
Pourquoi utiliser SC Supports & Resistances
Le support et la résistance restent parmi les concepts les plus importants en analyse technique, pourtant de nombreux traders tracent encore les niveaux manuellement, ce qui conduit à des interprétations subjectives et des résultats incohérents.
SC Supports & Resistances élimine cette incertitude en fournissant une approche objective et basée sur des règles pour identifier et gérer les niveaux clés du marché.
Cela permet aux traders de :
✔ Identifier plus rapidement les zones de réaction à haute probabilité
✔ Mesurer la force des niveaux de support et de résistance
✔ Détecter instantanément les cassures et rejets significatifs
✔ Améliorer le timing des entrées et sorties
✔ Réduire l’encombrement des graphiques
✔ Trader avec plus de confiance et de cohérence
Parfait pour
- Traders en action des prix
- Scalpers
- Day traders
- Swing traders
- Traders de tendance
- Traders Smart Money Concept (SMC)
- Traders support & résistance
- Analystes techniques professionnels
Note importante
SC Supports & Resistances identifie les niveaux en utilisant des pivots de marché confirmés et des calculs de volatilité adaptatifs.
La qualité et la fréquence des niveaux générés dépendent des réglages de sensibilité et des paramètres de réaction sélectionnés.
L’ajustement de ces paramètres permet aux traders d’adapter l’indicateur à différents marchés, styles de trading et unités de temps.
Identifiez les niveaux. Mesurez les réactions.
Tradez ce qui compte.
Résumé
Key functionalities include automatic detection and expiration of levels, intelligent swing-level recognition, and customizable sensitivity settings. Visual outputs feature dynamic bands, arrows, labels, and statistics to clearly represent zones and market reactions. This tool supports all markets and timeframes, providing objective, rules-based identification of key price levels to assist traders in recognizing potential reversals, trend continuations, breakout confirmations, and institutional reaction zones.
SC Supports & Resistances is suitable for various trading styles, including price action, scalping, day trading, swing trading, trend trading, and Smart Money Concept approaches. It aims to reduce chart clutter and improve entry and exit timing by maintaining a living framework of relevant support and resistance levels that evolve with market behavior.


