
3 Bar Triangle by Linda Raschke
Indicateur
536 téléchargements
Version 1.0, Sep 2024
Windows, Mac
5.0
Avis : 1
Description
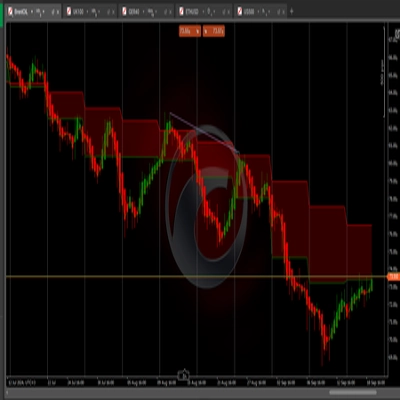
Ce modèle suggère une consolidation ou une compression des prix, où le prix se contracte dans une plage plus étroite. Le marché est en train de "se tendre" pour une éventuelle cassure dans l'une ou l'autre direction, conduisant généralement à un mouvement brusque une fois qu'il sort du triangle.
Trader la cassure :
- Entrée : Les traders recherchent une cassure au-dessus du plus haut du modèle ou en dessous du plus bas du modèle, indiquant la direction du mouvement suivant.
- Stop-loss : Placer un stop-loss de l'autre côté du triangle (soit au-dessus du plus haut, soit en dessous du plus bas) aide à gérer le risque.
- Objectifs : Certains traders visent un mouvement de prix égal à la taille du triangle (la distance entre le plus haut et le plus bas de la première barre)
Résumé
Résumé IA
The 3 Bar Triangle indicator by Linda Raschke identifies a consolidation pattern where price contracts within a narrowing range, forming a "triangle" shape over three bars. This pattern signals market "coiling," indicating potential for a sharp breakout in either direction once price moves beyond the triangle boundaries. Traders use this indicator to time entries by watching for a breakout above the pattern’s high or below its low, which suggests the direction of the next price move. Risk management involves placing stop-loss orders just outside the opposite side of the triangle to limit potential losses. Profit targets are often set based on the size of the triangle, aiming for a price movement equal to the distance between the high and low of the initial bar. This indicator supports breakout trading strategies by highlighting periods of price squeezing and potential volatility expansion.
Profil de l'indicateur
Avis clients
5.0
Avis : 1
5 | 100 % | |
4 | 0 % | |
3 | 0 % | |
2 | 0 % | |
1 | 0 % |
Avis clients
August 12, 2025
Pros: Identifies classic 3-bar triangle consolidation zones. Simple setup, visually clear. Stable across timeframes. Cons: No alerts or tooltips. Lacks volume filters and signal confirmation. Limited customization
Discussion
Questions fréquentes
Breakout
Les produits disponibles sur cTrader Store, notamment les bots de trading, les indicateurs et les plug-ins, sont fournis par des développeurs tiers et mis à disposition à titre informatif et à des fins d'accès technique uniquement. cTrader Store n'est pas un courtier et ne fournit aucun conseil en investissement, aucune recommandation personnelle ni aucune garantie quant aux performances futures.
Plus de cet auteur


![Logo de "[Stellar Strategies] Wave Trend Pro"](https://cdn.ctrader.com/image/webp/5f226fbb-245a-41cd-9cdd-b018257d5e6d_28617)


![Logo de "[Stellar Strategies] Smart ADX"](https://cdn.ctrader.com/image/webp/af13b084-b6f6-41db-b7bc-c7e688b57b05_36929)
Prix
Depuis le 19/09/2024
314.61K
Volume tradé
258.47K
Pips gagnés
536
Installations gratuites