


Description
Flintridge Trader Pro indique où le prix a déjà montré sa main, puis vous dit quand le marché tourne à ces endroits.
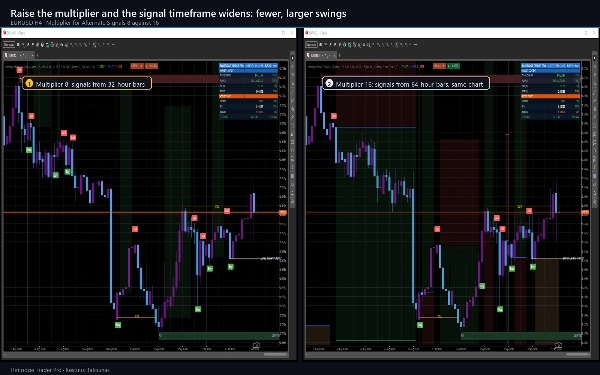
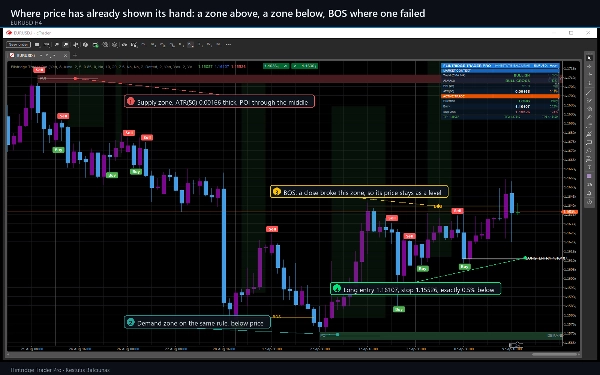
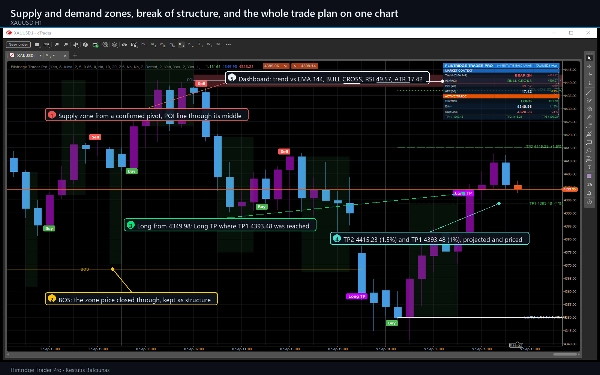
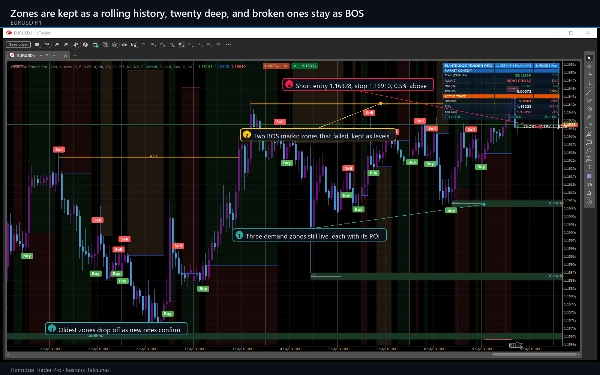
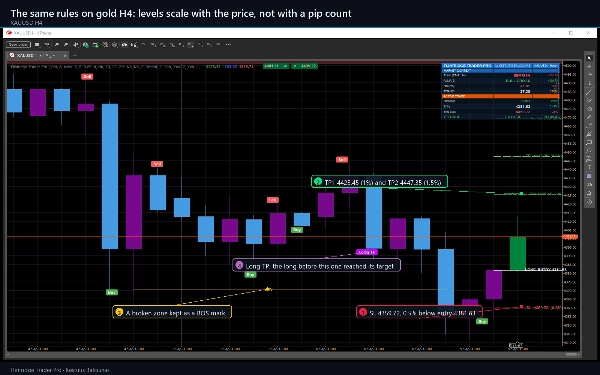
Les pivots de swing confirmés construisent des zones d'offre et de demande, chacune étant une bande épaisse d'ATR avec son point d'intérêt au milieu. Lorsque le prix clôture à travers une zone, elle est convertie en rupture de structure et marquée BOS, de sorte que le niveau qui a échoué reste sur le graphique comme information au lieu de disparaître. Séparément, une moyenne mobile des clôtures et une moyenne mobile des ouvertures sont calculées sur une période de temps PLUS ÉLEVÉE - huit fois votre graphique par défaut - et leur croisement est le signal.
Ce qu'il dessine sur votre graphique
- Zones d'offre et de demande issues des pivots de swing confirmés, chacune avec une ligne POI, conservées comme un historique roulant et converties en marque BOS lorsqu'elles sont rompues.
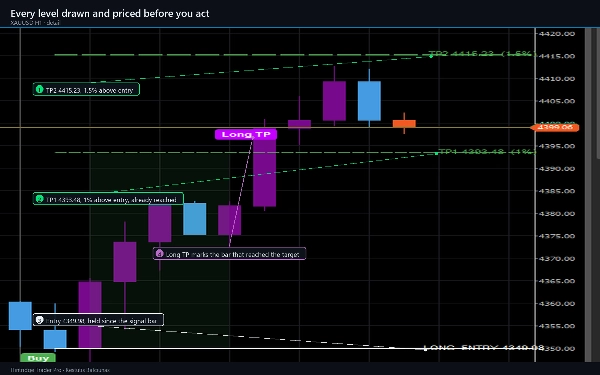
- Marqueurs d'achat et de vente, ainsi que marqueurs TP et SL longs lorsque un niveau est atteint.
- L'entrée, le stop et le premier objectif sous forme de lignes en escalier, avec une bande de risque ombrée et une bande de récompense ombrée entre elles.
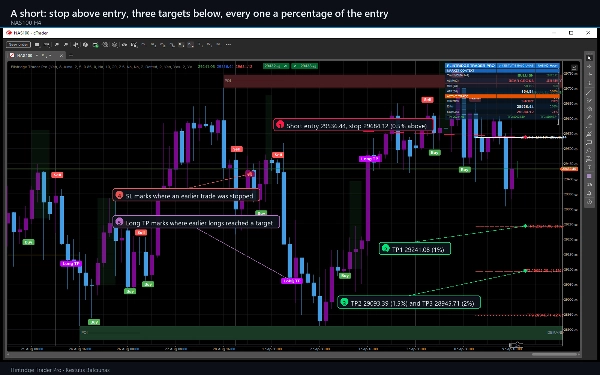
- Le dernier signal projeté vers l'avant, avec l'entrée, le stop et les trois objectifs dessinés et étiquetés avec leur prix et leur pourcentage.
- Étiquettes de swing HH, LH, HL et LL optionnelles, et une couche optionnelle de support et résistance avec jusqu'à 21 niveaux et leurs zones.
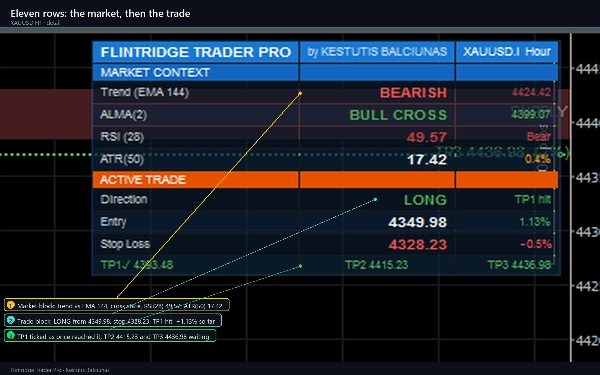
- Un tableau de bord à onze lignes : tendance par rapport à la EMA 144, état du croisement, RSI, ATR, puis le trade en direct avec sa direction, son étape, son entrée, son stop et ses trois objectifs, chacun coché lorsque le prix l'atteint.
- Bougies recolorées pour que la direction de chaque barre soit lisible d'un coup d'œil.
Comment trader avec
- Donnez-lui de l'historique. Avec les réglages par défaut, il a besoin d'environ 250 barres avant que quelque chose n'apparaisse, et il a besoin de suffisamment de données sur la période de temps supérieure pour que le premier croisement existe.
- Lisez d'abord les zones. Un achat à l'intérieur d'une zone de demande et une vente à l'intérieur d'une zone d'offre sont les configurations que l'outil est conçu pour vous montrer.
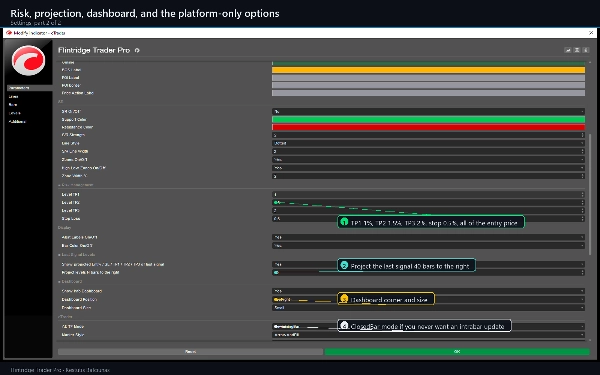
- Prenez les niveaux tels qu'ils sont dessinés. Le stop et les trois objectifs sont des pourcentages du prix d'entrée, 0,5, 1, 1,5 et 2 par défaut, et chacun d'eux est sur le graphique avant que vous n'agissiez.
- Utilisez le tableau de bord pour le contexte, pas pour la permission. La tendance, le croisement, le RSI et l'ATR décrivent le marché ; aucun d'eux ne bloque un signal à moins que vous n'activiez les filtres optionnels.
Paramètres les plus importants
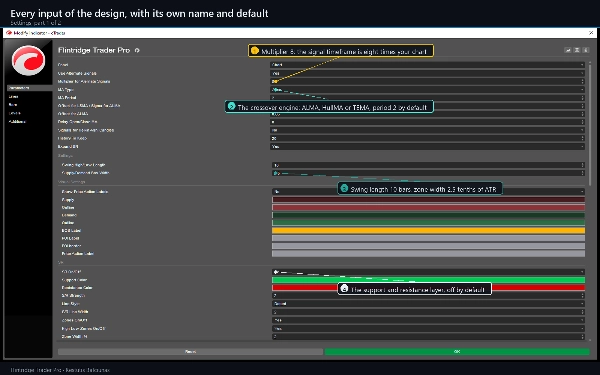
- Le type de MA et la période de MA choisissent le moteur de croisement : ALMA, HullMA ou TEMA.
- Le multiplicateur pour les signaux alternatifs définit à quel point la période de temps du signal est supérieure à votre graphique.
- La longueur du Swing High/Low et la largeur de la boîte d'offre/demande contrôlent combien de zones vous obtenez et leur épaisseur.
- Les niveaux TP1, TP2, TP3 et Stop Loss sont des pourcentages de l'entrée, et les shorts réutilisent les mêmes quatre chiffres.
- Trois filtres optionnels - une porte de tendance EMA 144, une porte RSI et un écart minimum de barres entre les entrées - sont fournis pour les traders qui veulent moins de signaux. Ils sont désactivés par défaut.
Où cela fonctionne
N'importe quel symbole et n'importe quelle période. Il a été conçu autour de M15, H1 et H4, et il est à l'aise sur les principales paires forex, l'or et les principaux indices ; il fonctionne aussi sur la crypto, où les zones ont tendance à être plus larges car l'ATR l'est. Les périodes plus basses donnent beaucoup plus de signaux, ce que les filtres optionnels et le multiplicateur de période supérieure sont là pour contrôler.
Alertes
Douze événements, chacun avec son propre interrupteur : entrées longues et courtes, les trois objectifs pour chaque direction, et les stops. Ils vont dans le journal cTrader, un son optionnel, et l'e-mail propre à cTrader. Les alertes se déclenchent uniquement sur les barres fermées, jamais pour l'historique qui s'est fermé avant que vous n'attachiez l'indicateur, et jamais deux fois pour la même barre.
Exigences et comportement
cTrader 5.0 ou plus récent, bureau. L'indicateur ne déclare aucun droit d'accès : il n'ouvre aucune connexion réseau, ne lit aucun fichier, et ne place, modifie ni ne ferme jamais d'ordre. Un signal est évalué sur une barre fermée et ne bouge pas ensuite. Deux choses sont provisoires pendant que la barre la plus récente se forme - la zone la plus récente, dont le pivot n'est pas encore confirmé, et la valeur de la période supérieure, qui est lue à partir de la barre contenant celle en cours. Un réglage est prévu pour lire la barre précédente complétée de la période supérieure à la place, ce qui ne repeint jamais.
Ceci est un logiciel analytique et rien de ce qu'il dessine n'est un conseil. Les marques de cible et de stop enregistrent seulement que le prix a touché un niveau dessiné sur l'historique chargé ; il n'y a pas d'écart, de commission ou de glissement derrière eux et aucun ordre n'a été placé.
Le trading comporte des risques. Les performances passées ne garantissent pas les résultats futurs.
Résumé
Key chart elements include supply and demand zones with points of interest, buy/sell markers, entry, stop loss, and three target levels displayed as stepped lines with shaded risk and reward bands. Optional swing labels (HH, LH, HL, LL) and a support/resistance layer with up to 21 levels are available. An eleven-row dashboard provides market context with trend, crossover state, RSI, ATR, and live trade details including stage, entry, stop, and targets.
Flintridge Trader Pro supports any symbol and timeframe, optimized for M15, H1, and H4 charts, and is suitable for forex majors, gold, major indices, and cryptocurrencies. It includes configurable settings for moving average type, swing length, zone width, and risk parameters. Alerts cover entries, targets, and stops, firing on closed bars only. The indicator is analytical software that does not place or manage orders.















![Logo de "[Hamster-Coder] Pivot Points MTF"](https://cdn.ctrader.com/image/webp/4c143e5a-309c-40e3-a578-f04d1e133ffa_31159)













