
Description
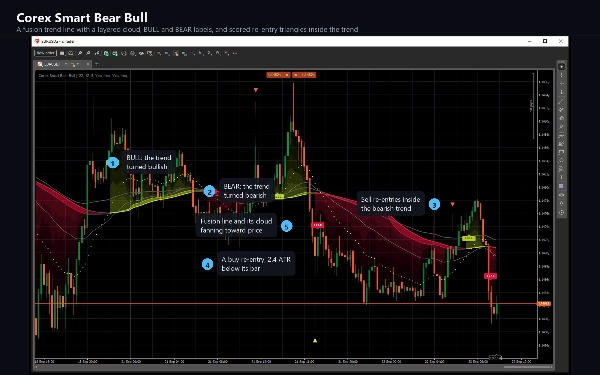
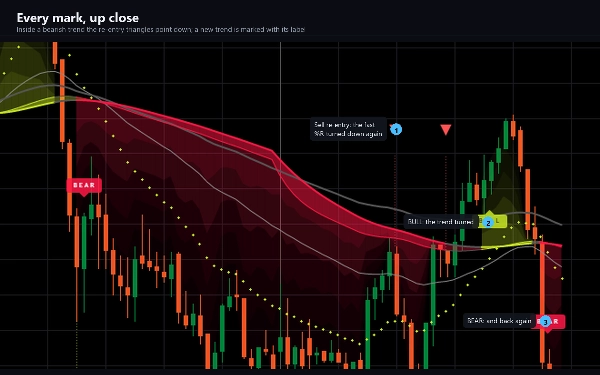
Corex Smart Bear Bull lit la tendance en deux couches : une ligne de fusion pour la direction, et un moteur Williams %R pour les moments d'action à l'intérieur.
LA LIGNE DE FUSION
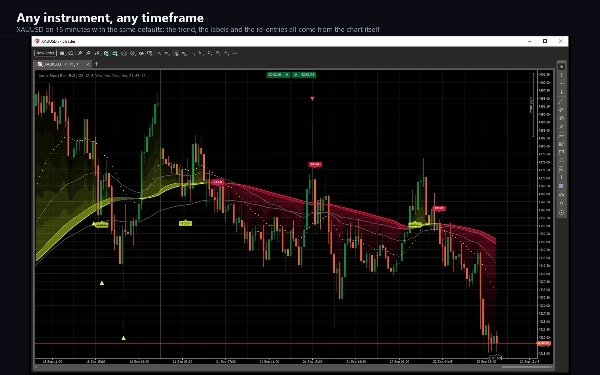
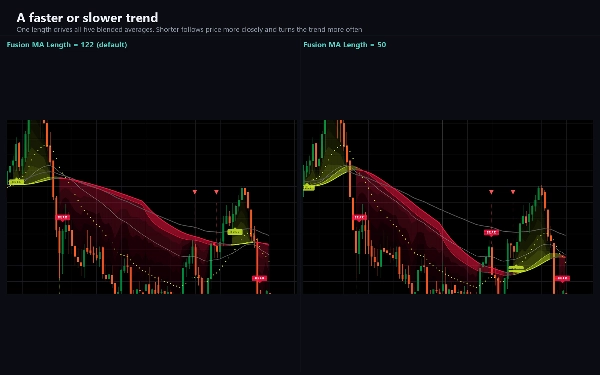
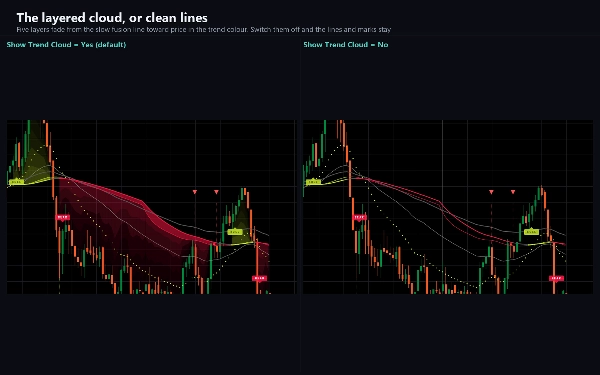
Cinq moyennes mobiles de même longueur - exponentielle, simple, pondérée, Arnaud Legoux et le VWAP de session - sont fusionnées en une seule et lissées en une ligne lente et une ligne rapide. Le marché est haussier tant que le prix clôture au-dessus d'une ligne lente ascendante, baissier tant qu'il clôture en dessous d'une ligne lente descendante, et neutre sinon ; les deux lignes prennent la couleur de cet état. Un nuage en couches s'étend depuis la ligne lente vers le prix dans la couleur de la tendance, s'estompant couche par couche, et une bande entre les lignes lente et rapide montre laquelle des deux mène.
ÉTIQUETTES DE TENDANCE
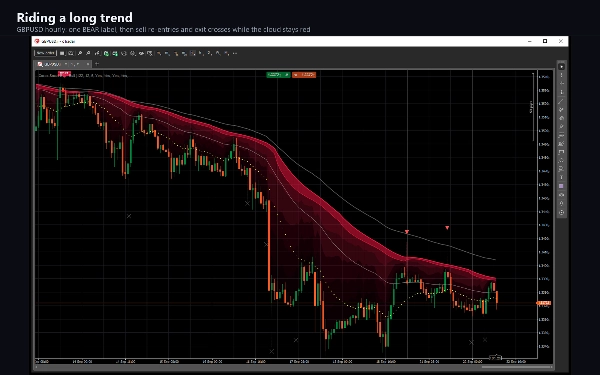
Une étiquette BULL apparaît sous la barre où le marché devient haussier, et une étiquette BEAR au-dessus de la barre où il devient baissier. Un temps de refroidissement maintient deux étiquettes dans une même direction à un nombre défini de barres d'écart.
TRIANGLES DE RÉ-ENTRÉE ET SORTIES
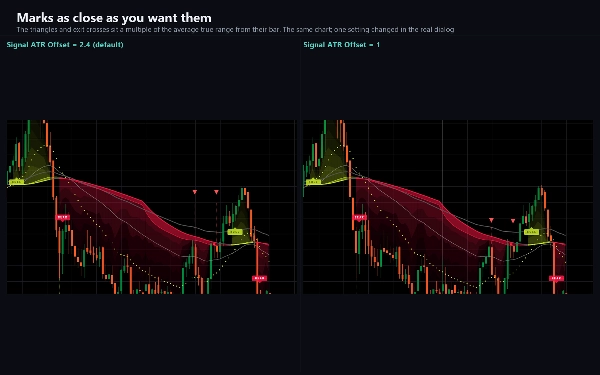
Lorsque le marché est haussier, un triangle vert citron sous une barre marque une ré-entrée d'achat ; lorsqu'il est baissier, un triangle rouge au-dessus d'une barre marque une ré-entrée de vente. Ils proviennent d'un moteur Williams %R avec trois périodes : une ligne rapide franchissant sa zone de survente ou de surachat déclenche un candidat, et cinq types de déclencheurs sont reconnus - rebond depuis un extrême, épuisement, continuation, repli, et les trois lignes étirées simultanément. Chaque candidat est noté de 0 à 100 selon les lectures, le rythme du mouvement, la session de trading, la position par rapport aux moyennes 50 et 200, le RSI et le volume ; plusieurs déclencheurs sur une même barre ajoutent un bonus, et un score minimum filtre les faibles. Une porte de tendance bloque les candidats contre-tendance tant que les lignes plus lentes montrent une tendance forte, sauf si la ligne rapide s'est déjà remise d'un extrême. Après une ré-entrée, le premier signal opposé à l'intérieur de la tendance marque une sortie avec une croix grise. Chaque marque est placée à un multiple de l'average true range de la barre, reliée à celle-ci par une ligne pointillée.
PARAMÈTRES
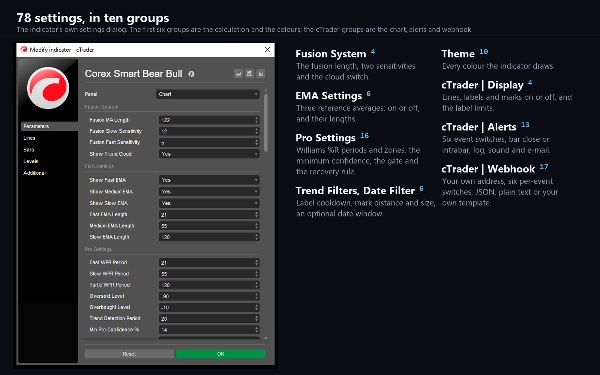
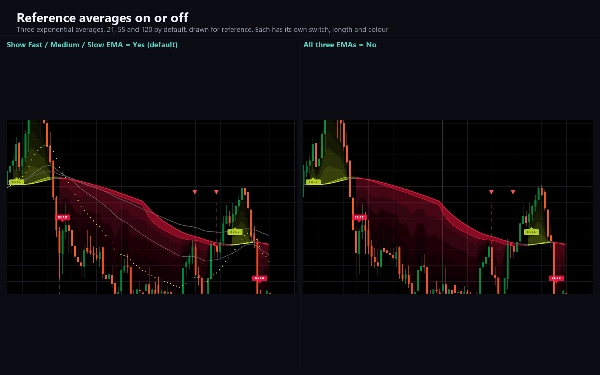
La longueur de fusion et ses deux sensibilités, les trois moyennes de référence, les trois périodes Williams %R et leurs zones, la confiance minimale, la porte et ses niveaux, la règle de récupération, le temps de refroidissement des étiquettes, la distance et la taille des marques, une fenêtre de date optionnelle, et dix couleurs. Chaque élément graphique a son propre interrupteur, et désactiver l’un d’eux modifie uniquement le dessin : les valeurs, alertes et webhook continuent.
ALERTES ET WEBHOOK
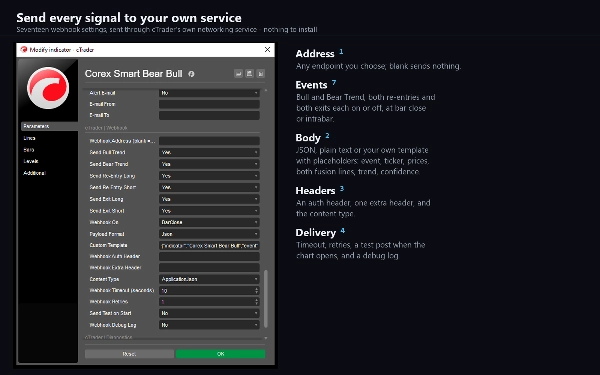
Six événements : Tendance Haussière, Tendance Baissière, Ré-entrée Longue, Ré-entrée Courte, Sortie Longue et Sortie Courte. Chacun a son propre interrupteur et peut se déclencher à la clôture de la barre ou dès que la condition est remplie. La livraison peut être une ligne de journal, un son ou un e-mail. Il y a aussi un webhook : entrez une adresse et chaque événement y est posté en JSON, en texte brut, ou dans un modèle que vous écrivez vous-même avec des espaces réservés pour le symbole, la période, l’heure, les prix, les deux lignes de fusion, la tendance et les deux scores de confiance. Il reste désactivé tant que vous n’en avez pas saisi un, n’envoie rien pendant le passage historique ou en backtest, et ne nécessite aucun droit d’accès spécial - les posts sortent via le service réseau propre à cTrader.
POUR LES cBOTS
Quatorze séries de sortie : les deux lignes de fusion, les trois moyennes, la tendance, les deux scores de confiance et une série par événement.
TYPE ET FENÊTRE
Un indicateur de tendance avec signaux, dessiné sur le graphique des prix.
UNITÉS DE TEMPS ET INSTRUMENTS
Toute unité de temps basée sur le temps ; les valeurs par défaut fonctionnent bien de M5 à H4. Il fonctionne sur tout instrument - paires forex, métaux, indices et crypto. Le VWAP de session et le filtre de volume utilisent le volume tick du courtier, et la journée de session commence à 17h00 heure de New York.
À QUI IL S’ADRESSE
Aux traders qui suivent une tendance et veulent des moments marqués et notés pour la rejoindre ou s’en écarter, avec une alerte à chaque fois.
REMARQUES
Les marques suivent la barre encore en formation, donc une peut apparaître et disparaître jusqu’à la clôture de cette barre. Les alertes et posts webhook par défaut se déclenchent à la clôture de la barre, où la condition est définitive. Le graphique conserve les 500 dernières étiquettes et 50 lignes de connexion ; un interrupteur d’affichage les garde toutes.
Le trading comporte des risques. Les performances passées ne garantissent pas les résultats futurs.
Résumé
The indicator features BULL and BEAR labels marking trend reversals, with a cooldown period to space labels. It uses a Williams %R engine with three periods to identify scored re-entry points via colored triangles (lime for buy, red for sell) and exit markers (gray crosses). These signals are scored based on multiple factors including momentum, session, position relative to moving averages, RSI, and volume. A trend gate filters counter-trend signals during strong trends.
Settings allow customization of fusion length, sensitivities, reference averages, Williams %R parameters, confidence thresholds, label cooldown, and visual elements. Alerts and webhook notifications are available for six event types, delivering data via log, sound, email, or customizable JSON posts. The indicator outputs multiple data series for integration with cBots.