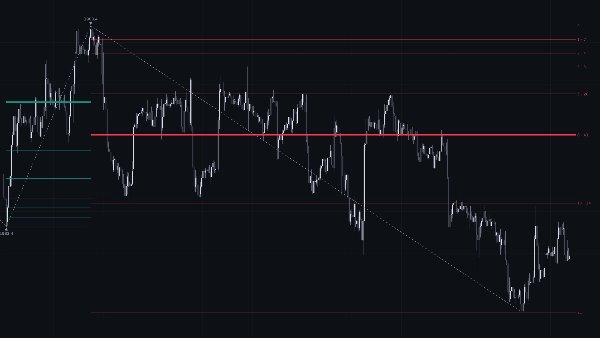
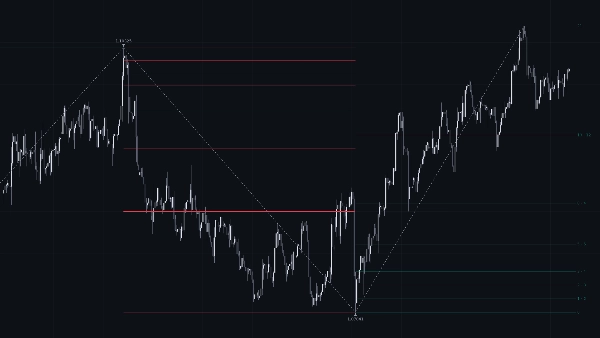
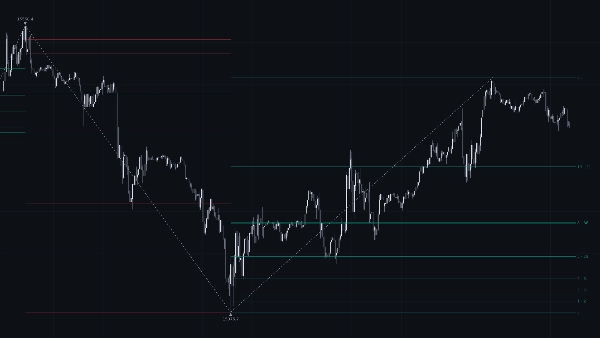
Description
Fibonacci Swing Levels [Iridio Capital]
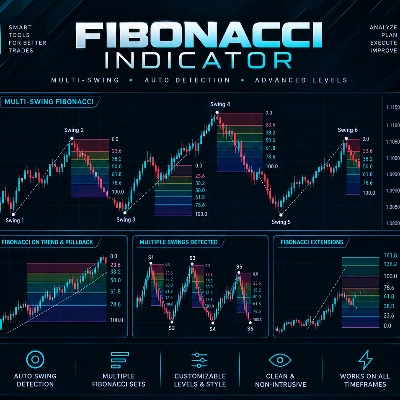
Fibonacci Swing Levels finds the major swings in price automatically. On each swing it draws a ladder of levels based on the Fibonacci number sequence. It also shows how many times price has retested each level, so you can see which levels the market respects and which ones it ignores.
HOW IT WORKS
1. Swing detection (ZigZag)
A bar becomes a swing high when its high is the highest high of the last N bars (ZigZag Depth). A swing low works the same way with the lowest low. Each time the direction changes, a dashed ZigZag line connects the swing points and a small marker shows the swing price. The default Depth of 150 keeps only the main market structure and filters out the noise.
2. Fibonacci sequence levels
Each swing is divided into 21 equal parts. Levels are drawn at the Fibonacci numbers 0, 1, 2, 3, 5, 8, 13 and 21. Level 0 is the swing origin and level 21 is the swing extreme. Most levels sit close to the origin and get further apart toward the extreme. This gives fine detail near the swing start, where price often reacts.
- Bullish swing (low to high): levels are drawn in the Bullish Color and counted up from the swing low.
- Bearish swing (high to low): levels are drawn in the Bearish Color and counted down from the swing high.
3. Retest frequency
For every level, the indicator counts the bars whose range has crossed it since the swing began. The more retests a level has:
- the stronger and more opaque its color,
- the thicker its line (one step every 10 retests).
A faint, thin level has rarely been touched. A bold, thick level has been tested again and again.
4. Live and historical levels
Levels of the active swing extend 5 bars to the right of the current bar. Each one has a small label showing the level number and its retest count, for example "8 · 12". When the swing completes and the direction changes, its levels stay frozen on the chart. You can study how price reacted to them in the past.
The swing that is still forming is recalculated on every tick from the last closed bar. If price cancels a provisional swing, it is removed. The indicator never keeps signals that the market has invalidated.
HOW TO USE IT
- Support and resistance: in an active bullish swing, the levels act as possible support during pullbacks. In a bearish swing, they act as possible resistance during rallies. Levels with many retests are the zones the market has respected most.
- Pullback entries: wait for price to come back to a well-tested level. Then look for confirmation from your own method, such as price action, a lower-timeframe structure break or volume, before you enter.
- Targets and stops: use the next level in the direction of the trade as a partial target. Place stops beyond the level that held, or beyond the swing origin (level 0).
- Market structure: the ZigZag shows the trend at a glance. Higher highs and higher lows mean an uptrend. Lower highs and lower lows mean a downtrend.
- Timeframes: it works on any symbol and timeframe. Lower the Depth on higher timeframes or for faster swings. Raise it on lower timeframes to keep only the major structure.
PARAMETERS
ZigZag
- ZigZag Depth (default 150): number of bars used to confirm a swing high or low. A higher value gives fewer, larger swings.
- ZigZag Color: color of the ZigZag lines and swing price markers.
Levels
- Bullish Color / Bearish Color: colors of the levels on bullish and bearish swings.
- Retest Limit (default 30): number of retests at which a level reaches full color intensity. Lower it on markets that move fast, so strong levels stand out sooner.
Labels
- Label Size (default 8): font size of the level labels on the right.
Advanced
- Calculated Bars (default 3000): number of recent bars used in the calculation. Set it to 0 to use all loaded history.
- Max Lines / Max Labels (default 500 / 50): maximum number of objects kept on the chart. When a limit is reached, the oldest objects are removed first.
NOTES
- The indicator draws on the price chart and does not repaint closed bars. Only the swing that is still forming can change until it is confirmed.
- It is an analysis tool and does not give buy or sell signals on its own. Use it together with your own risk management.