Penerangan
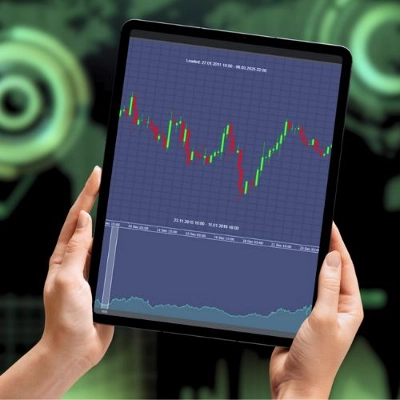
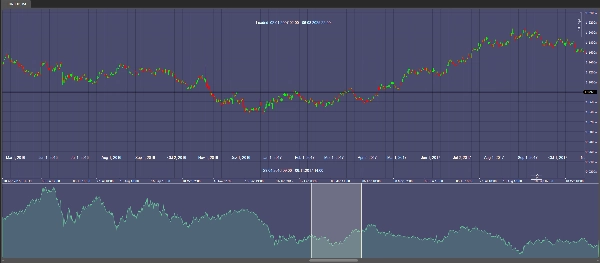
ChartOverview memastikan anda sentiasa dimaklumkan sepenuhnya mengenai julat data pasaran secara keseluruhan, dari titik data paling awal hingga yang terkini. Di bahagian atas carta anda, anda dapat melihat paparan jelas bagi jangka masa yang dimuatkan sepenuhnya, manakala tempoh yang kelihatan sekarang dipaparkan terus pada carta untuk pandangan masa nyata.
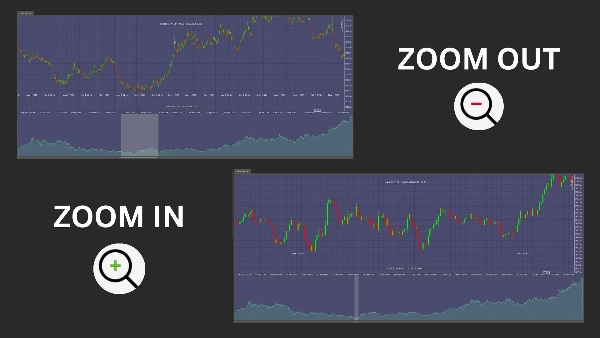
Penunjuk dinamik ini dikemas kini dengan lancar semasa anda menatal, menyeret, atau mengubah saiz carta anda, memastikan anda sentiasa mempunyai maklumat terkini. Reka bentuk intuitifnya membolehkan anda mengenal pasti trend dan peluang pasaran dengan cepat, meningkatkan keupayaan anda untuk membuat keputusan perdagangan yang tepat pada masanya dan berinformasi.
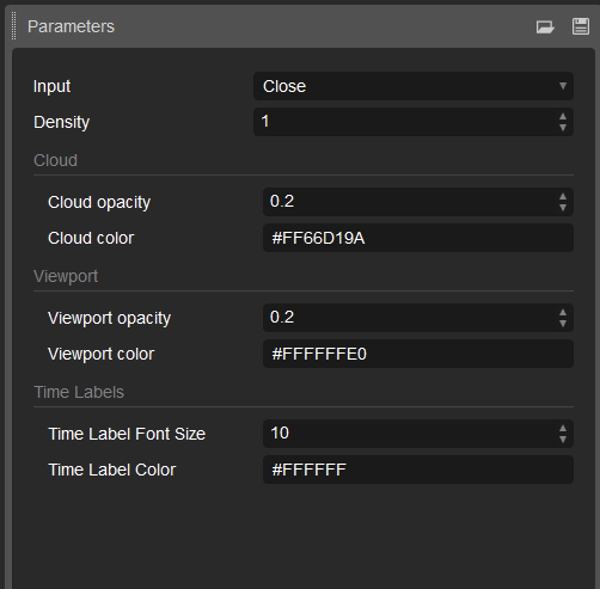
Dengan pilihan penyesuaian yang luas untuk warna, kelegapan, dan tetapan paparan, ChartOverview menyatu dengan sempurna ke dalam susunan perdagangan peribadi anda. Memperkasakan analisis anda dan memperoleh kelebihan daya saing dengan alat yang direka untuk memberikan gambaran pasaran yang tepat dan menyeluruh.
Ringkasan
Ulasan pelanggan
5 | 100 % | |
4 | 0 % | |
3 | 0 % | |
2 | 0 % | |
1 | 0 % |