
Description
Cet indicateur est un outil de gestion des risques. Les détails sont les suivants :
1) Type d'ordre : Ordre limité, Ordre au marché, Ordre stop ;
2) Méthode de risque : Montant fixe (par exemple, 200 $, l'utilisateur peut saisir), Pourcentage du solde du compte (par exemple, 1 %, l'utilisateur peut saisir) ;
3) Ratio risque-rendement : L'utilisateur peut saisir cette valeur, par exemple triple profit. Le système calcule automatiquement la taille de lot négociable, le prix d'entrée, les pips et le prix du stop-loss, ainsi que les pips et le prix du take-profit en fonction des valeurs définies ;
4) Prix d'entrée : Par défaut, le prix actuel de l'instrument courant, l'utilisateur peut modifier et saisir manuellement ;
5) Pips de stop loss : Par défaut, 10 * spread du symbole (l'utilisateur peut modifier et saisir manuellement) ;
6) Taille du lot : Calculée automatiquement ;
7) Prise de profit : Calculée automatiquement (y compris les pips et le prix) ;
8) Prix du stop loss : Calculé automatiquement.
Au bas de l'interface se trouvent les boutons « Passer commande » pour exécuter les opérations de placement d'ordre basées sur les paramètres ci-dessus.
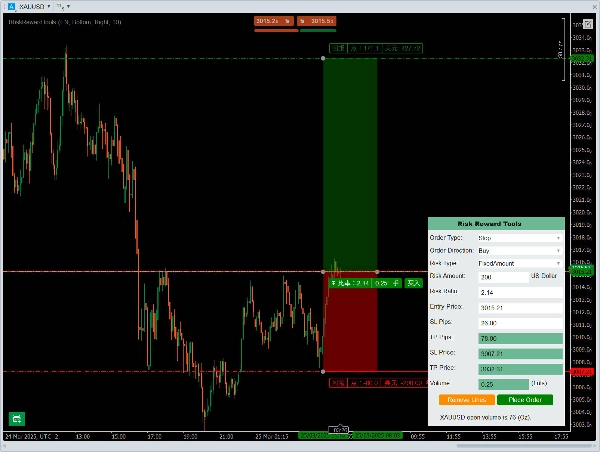
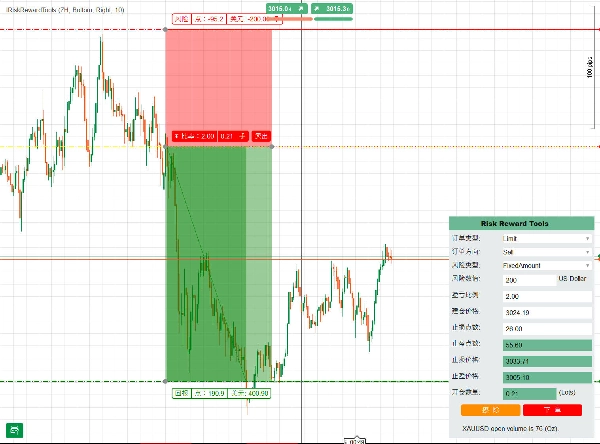
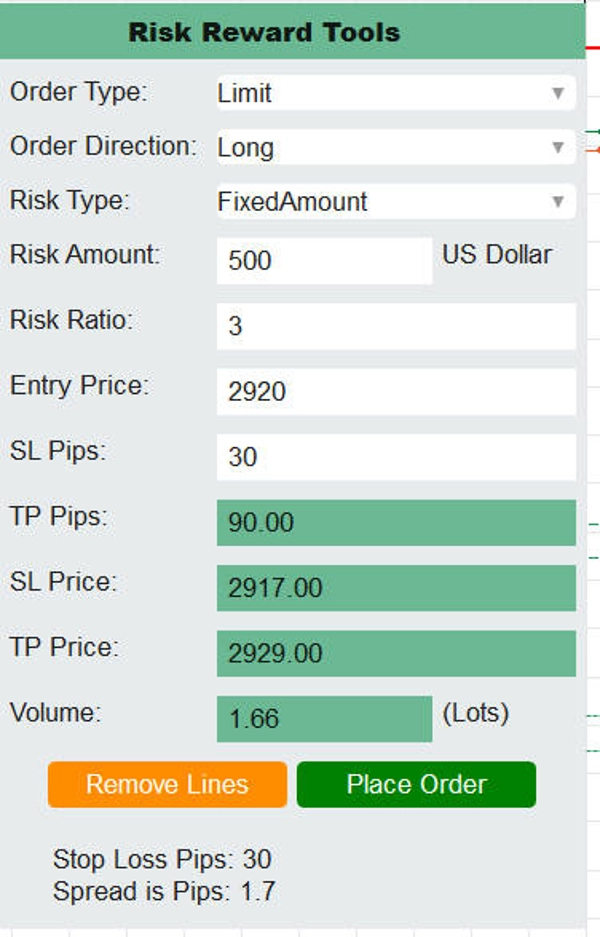
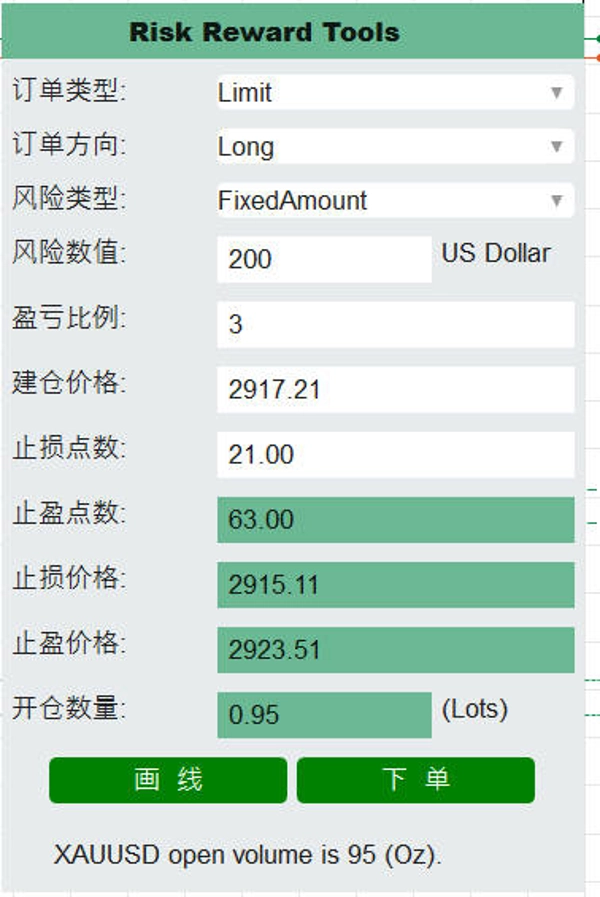
Tout d'abord, cet indicateur est un outil de gestion des risques, l'interface utilisateur comprend divers contrôles d'entrée tels que des menus déroulants, des zones de texte et des boutons, utilisés pour calculer les paramètres tels que la taille du lot, le stop loss, le take profit, etc. L'utilisateur peut choisir le type d'ordre (limite, marché, stop), la direction (long/court), le type de risque (montant fixe ou pourcentage), saisir la valeur du risque, le ratio risque-rendement, le prix d'entrée, puis calculer le prix de stop loss correspondant, les pips et prix de take profit, ainsi que la taille du lot, et fournir une fonction de passage d'ordre. Les explications sont les suivantes :
1) Type d'ordre : Ordre limité, ordre au marché, ordre stop :
2) Méthode de risque : Montant fixe (par exemple 200 dollars, l'utilisateur peut saisir), pourcentage du solde du compte (par exemple 1 %, l'utilisateur peut saisir) ;
3) Ratio profit/perte : L'utilisateur peut saisir lui-même, par exemple 3 fois. Le système calcule automatiquement la taille de lot pouvant être ouverte, le prix d'ouverture, les pips et le prix du stop loss, les pips et le prix du take profit selon les valeurs définies ;
4) Prix d'ouverture : Par défaut, c'est le prix actuel de l'instrument, l'utilisateur peut modifier et saisir ;
5) Pips de stop loss : Saisir les pips de stop loss, calcul automatique de la taille de lot, du prix de stop loss, du prix de take profit, etc., et possibilité de visualiser les informations de position correspondantes sur le graphique via la fonction de dessin de ligne ;
6) Taille de lot : Calcul automatique ;
6) Take profit : Calcul automatique (y compris les pips et le prix) ;
7) Stop loss : Calcul automatique (y compris les pips et le prix).
Au bas de l'interface se trouve le bouton « Passer commande », qui permet d'exécuter l'opération de passage d'ordre selon les paramètres définis ci-dessus. Veuillez regarder la vidéo de présentation :


![Logo de "Smart Money Concepts (SMC) [Iridio Capital]"](https://cdn.ctrader.com/image/webp/28b69fd1-ef54-4bed-9487-07e78e883be4_40934)
