Deskripsi
Trade Analytics
Pahami kualitas keunggulan trading Anda dengan dashboard analitik ringkas yang berfokus pada ekspektasi, ketahanan, dan struktur kinerja.
Trade Analytics adalah plugin analitik yang kuat yang dibuat untuk trader yang menginginkan lebih dari sekadar angka untung dan rugi. Alih-alih hanya menunjukkan apa yang dihasilkan trading Anda, ini membantu Anda memahami bagaimana hasil Anda diproduksi dan apakah keunggulan Anda tampak kuat, seimbang, dan dapat diandalkan.
Plugin ini berfokus pada kualitas statistik trading Anda dengan menyoroti ekspektasi, struktur pembayaran, konsentrasi keuntungan, kekuatan pemulihan, konsistensi, dan perilaku waktu tahan dalam dashboard bersih yang dibangun langsung di dalam cTrader.
Fitur Utama
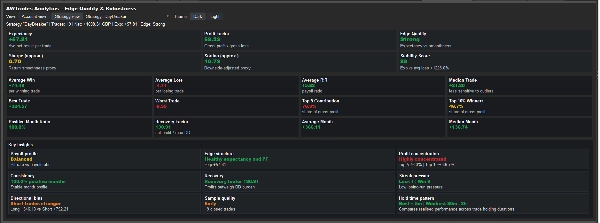
Dashboard kualitas keunggulan
Cepat menilai kualitas keseluruhan pendekatan trading Anda dengan metrik utama yang jelas, termasuk:
• Ekspektasi
• Faktor Keuntungan
• Sharpe (perkiraan)
• Sortino (perkiraan)
• Skor Stabilitas
• Penilaian Kualitas Keunggulan
Ini memberi Anda pandangan cepat apakah hasil trading Anda tampak kuat, mulus, atau rapuh.
Analisis struktur pembayaran
Pahami bagaimana keunggulan Anda dibangun dengan meninjau:
• Rata-rata kemenangan
• Rata-rata kerugian
• Profil imbalan-terhadap-risiko rata-rata
• Perdagangan median
• Perdagangan terbaik
• Perdagangan terburuk
Ini membantu Anda melihat apakah strategi Anda lebih bergantung pada tingkat keberhasilan, pembayaran, atau kombinasi keduanya.
Panel wawasan utama
Trade Analytics mengubah statistik mentah menjadi seperangkat kesimpulan yang lebih mudah dibaca, menyoroti area seperti:
• Profil pembayaran
• Struktur keunggulan
• Konsentrasi keuntungan
• Konsistensi
• Kekuatan pemulihan
• Tekanan rentetan
• Bias arah
• Kualitas sampel
• Pola waktu tahan
Ini membuat dashboard lebih mudah diinterpretasikan sekilas.
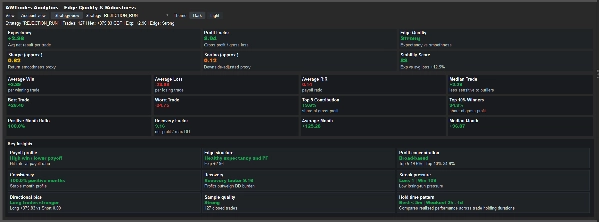
Konsentrasi keuntungan dan ketahanan
Lihat apakah hasil Anda tersebar luas atau sangat bergantung pada sejumlah kecil perdagangan.
Termasuk:
• Kontribusi 5 teratas
• Kontribusi pemenang 10% teratas
• Faktor pemulihan
• Rasio bulan positif
• Penilaian stabilitas
Ini membantu mengidentifikasi apakah kinerja tampak berkelanjutan atau terlalu bergantung pada outlier.
Wawasan pola waktu tahan
Trade Analytics membandingkan kinerja yang direalisasikan di berbagai durasi tahan perdagangan untuk menunjukkan di mana keunggulan Anda paling kuat atau lemah.
Ini tidak mengasumsikan tahan yang lebih pendek atau lebih lama secara inheren lebih baik. Sebaliknya, ini menunjukkan apa yang sebenarnya bekerja terbaik dalam sampel yang dipilih.
Tampilan akun dan strategi
Analisis seluruh riwayat akun Anda atau fokus hanya pada strategi yang diberi label.
Gunakan:
• Tampilan akun
• Tampilan strategi
• Pemilih strategi
• Tema Gelap dan Terang
Ini memudahkan untuk meninjau baik kinerja keseluruhan maupun sistem individual.
Dibuat untuk trader yang menginginkan wawasan kinerja lebih dalam
Trade Analytics ideal untuk trader yang ingin memahami tidak hanya apa yang terjadi, tetapi seberapa kuat dan dapat diandalkannya keunggulan trading mereka sebenarnya.
Ini berguna untuk:
• Trader manual yang meninjau kualitas eksekusi mereka
• Trader sistem yang menganalisis kekuatan strategi
• Penyedia sinyal yang menilai ketahanan dan konsistensi
• Trader yang membandingkan berbagai strategi berlabel dalam satu akun
Pasangan sempurna dengan alat AWTrades lainnya:
Trade Analytics dirancang untuk melengkapi toolkit AWTrades yang lebih luas:
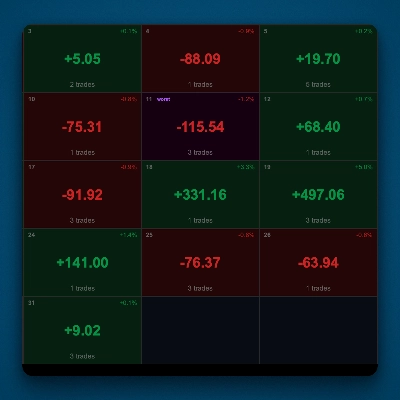
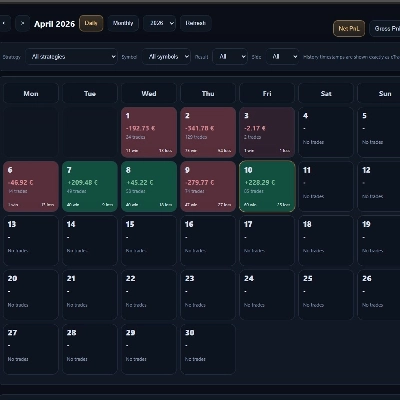
• PnL Studio – untuk tinjauan kinerja visual, drilldown harian, dan analisis berbasis kalender
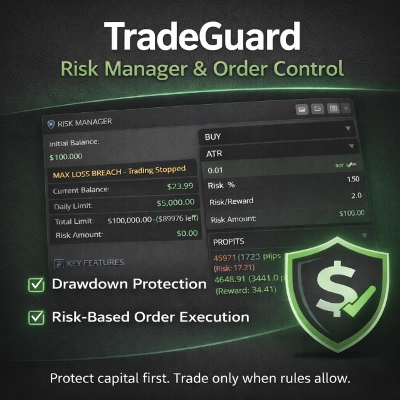
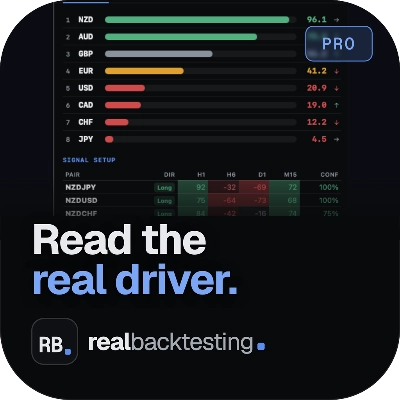
• Risk Watch – untuk pemantauan eksposur langsung, risiko terbuka, dan risiko kasus terburuk
Bersama-sama, ketiga plugin ini menyediakan alur kerja trading yang lebih lengkap:
- PnL Studio = tinjauan kinerja visual
- Risk Watch = pemantauan risiko langsung
- Trade Analytics = analisis kualitas keunggulan dan ketahanan
Bersih, ringan, dan mudah digunakan
Plugin berjalan langsung di dalam cTrader dan tidak memerlukan perangkat lunak eksternal.
Cukup buka tab Trade Analytics untuk langsung meninjau kualitas statistik, struktur, dan ketahanan kinerja trading Anda.
Ringkasan
The plugin analyzes payoff structure by presenting average wins and losses, reward-to-risk profiles, median, best, and worst trades, helping users understand whether their strategy relies more on hit rate or payoff. A key insights panel translates raw data into readable conclusions covering payoff profile, edge structure, profit concentration, consistency, recovery strength, streak pressure, directional bias, sample quality, and holding time patterns.
Trade Analytics also evaluates profit concentration and robustness by showing contributions from top trades, recovery factors, positive month ratios, and stability scoring to identify performance sustainability. It compares realized performance across different trade holding durations without bias toward any specific timeframe.
Users can analyze either their full account history or individual labeled strategies, with options for account or strategy views and theme customization. The plugin complements other AWTrades tools like PnL Studio and Risk Watch, forming a comprehensive trading analysis workflow. It runs directly inside cTrader without requiring external software.