present
Inscrivez-vous et bénéficiez d'une remise de 50 $ sur votre premier achat
Trading product for Monthly Return Table Indicateur Drawdown Monitor, image 1
Monthly Return Table
Indicateur
Version 1.0, Jul 2026
Windows, Mac
Trading product for Monthly Return Table Indicateur Drawdown Monitor, image 2
Trading product for Monthly Return Table Indicateur Drawdown Monitor, image 3
Trading product for Monthly Return Table Indicateur Drawdown Monitor, image 4
Trading product for Monthly Return Table Indicateur Drawdown Monitor, image 5
Trading product for Monthly Return Table Indicateur Drawdown Monitor, image 6
Trading product for Monthly Return Table Indicateur Drawdown Monitor, image 7
Depuis le 22/09/2024
15
Ventes
3.88K
Installations gratuites

Description

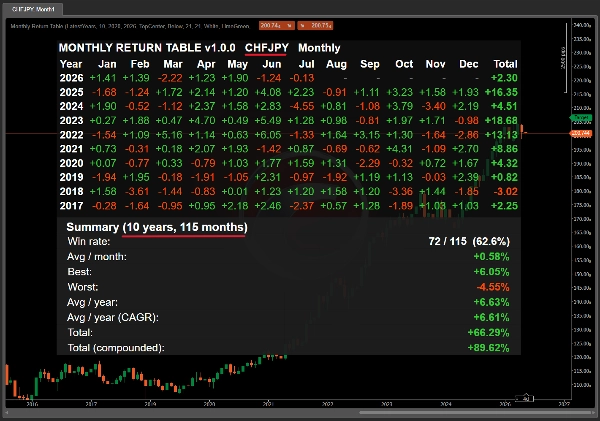
See any asset's historical performance in one glance — no backtest required.


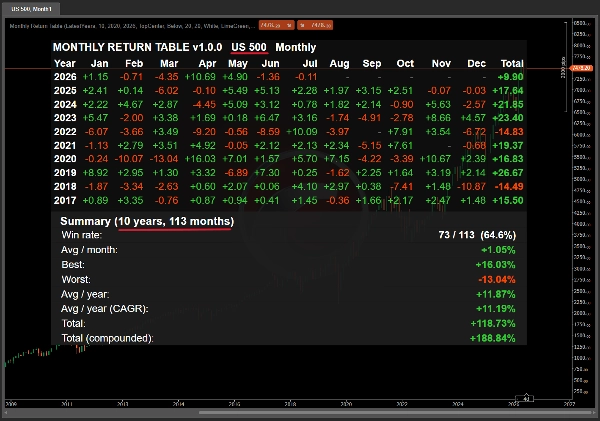
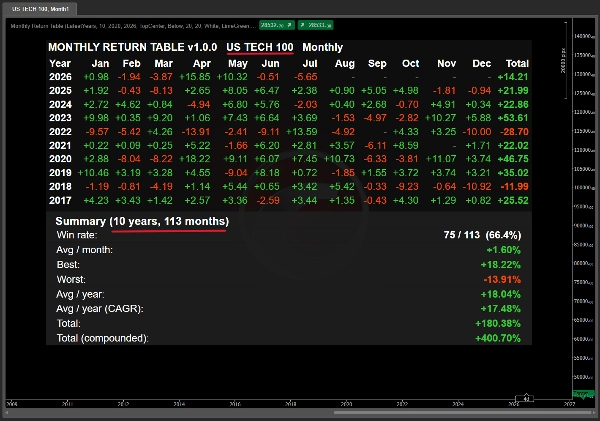
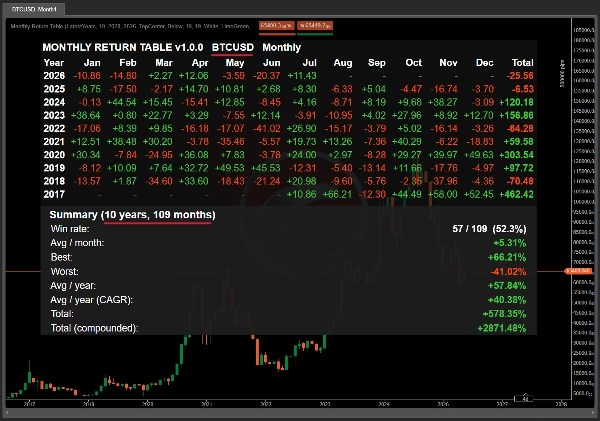
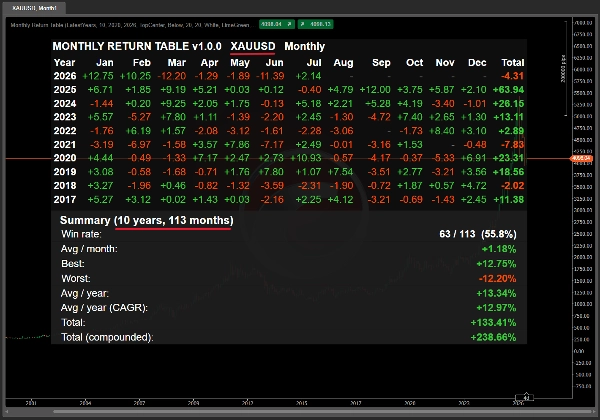
Drop it on any chart. Instantly see monthly returns for the last 10+ years, color-coded by profit and loss, with a full statistical summary. Works on any symbol, any timeframe — Forex, Metals, Indices, Crypto. The fastest way to answer: "Is this asset actually worth trading?"


WHAT IT DOES


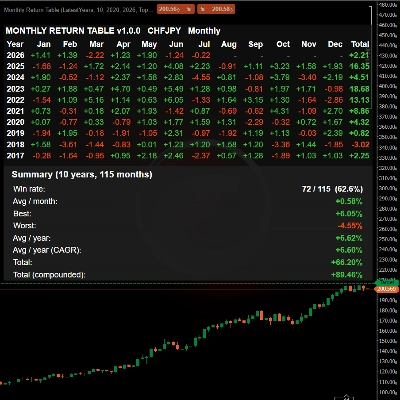
Monthly Return Table calculates the monthly percentage return of any asset — open of the first bar of the month to close of the last bar — and displays it as a clean, color-coded matrix directly on your chart.


No backtest. No optimization. No waiting.

Attach it, and the entire performance history appears in under a second.


WHY IT EXISTS


Before you invest capital, deploy a bot, or design a strategy, you should know one thing: how has this asset actually behaved?


Most traders skip this step. They open a chart, see recent price action, and make decisions based on the last few months. Monthly Return Table forces you to look at the full picture — every month, every year, side by side.


You'll immediately see:

• Which months tend to be strong or weak (seasonality)

• Whether the asset trends or ranges over time

• The realistic drawdown you should expect

• The compounded return of simply holding through each month


KEY FEATURES


• Full monthly matrix — 12 months × up to 30 years, all on one screen

• Color-coded cells: green profit, red loss

• Complete statistical summary: Win rate, Avg/month, Best, Worst, Avg/year, CAGR, Total (simple + compounded)

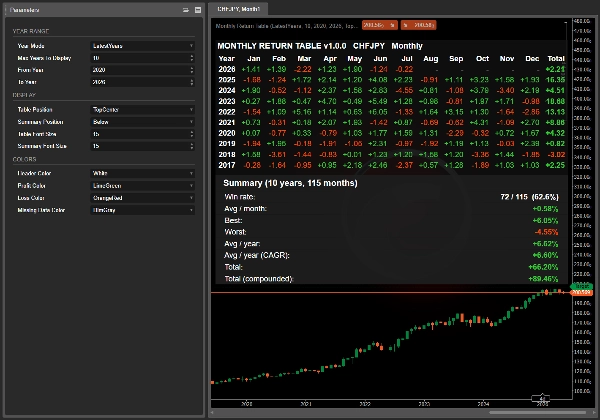
• Year Mode: Latest N years OR specific range (e.g. 2020-2022)

• 9 chart positions, adjustable font sizes, custom colors

• Timezone-aware month detection — works correctly with every broker

• Zero configuration required

• No repainting, no lag, no external data


WHO THIS IS FOR


• Retail traders who want to stop guessing and decide based on real historical data

• Bot users and buyers who want to evaluate a symbol before committing capital

• Portfolio builders comparing candidates for consistent, compoundable returns

• Content creators needing clean, professional performance visualizations


WHAT IT IS NOT


This is not a trading signal. It doesn't tell you when to buy or sell. It doesn't predict the future.


What it does is answer a simple, foundational question every trader should ask before touching an asset: "Show me the numbers."


Stop guessing. Start seeing.


Built by Black Rock — Forex & Gold trading specialists. Full support via cTrader messaging. Updates included.

Résumé

Profil de l'indicateur
Catégorie de l'indicateur
Tendance
Type de résultat
Filtre
Exigences en matière de données
Barres seulement

Discussion

Avis clients

0.0
Avis : 0
Avis clients
Il n'y a pas encore d'avis sur ce produit. Vous l'avez déjà essayé ? Soyez le premier à en parler aux autres !

Questions fréquentes

Drawdown Monitor
Les produits disponibles sur cTrader Store, notamment les bots de trading, les indicateurs et les plug-ins, sont fournis par des développeurs tiers et mis à disposition à titre informatif et à des fins d'accès technique uniquement. cTrader Store n'est pas un courtier et ne fournit aucun conseil en investissement, aucune recommandation personnelle ni aucune garantie quant aux performances futures.

Plus de cet auteur
cBot
BTCUSD
GBPUSD
+4
Scalping V.1 (Stop Order TP + SL)
cBot
Grid
Forex
+5
Algo Forex Strategy
cBot
NAS100
XAUUSD
+3
Renko SPX500
cBot
BTCUSD
NAS100
+4
Renko Strategy
cBot
Grid
Forex
+2
Algo Forex (Free Trial_USDJPY)
Logo de "The Secret Fund"
Statistiques en direct
$990
/
$1900
cBot
Grid
Prop
+4
The Secret Fund ( Secret from Hedge Fund Strategy)
Logo de "Algo Forex (Trial)"
Les mieux notés
4.8
(7)
Gratuit
cBot
AI
Grid
+7
Algo Forex Strategy ( Trial )
cBot
Grid
XAUUSD
+2
🔥 Grid Classic – A Simple Yet Powerful Grid System
cBot
BTCUSD
EURUSD
+8
Renko Strategy Free Trial
cBot
AI
Grid
+9
Stop gambling your capital. Switch to a truly sustainable "System" instead.
cBot
ATR
RSI
+5
Shift from “Price Chasing” to “Price Trapping” using Limit Orders and a Volatility-Based Calculation System
cBot
AI
Grid
+3
HFT SuperFund Pro+

Vous pourriez aussi aimer

Indicateur
Volume
Key Levels
View tick activity across a selected chart range with Point of Control, Value Area High and Value Area Low.
Indicateur
ATR
RSI
+17
Turn data into precision trades with AlphaTrend Pro Max — advanced trend, signal & structure analysis in one.
Indicateur
ATR
MSS
+5
Advanced market structure and institutional cycle mapper with visual reference cards and entry alerts
Indicateur
AI
SMC
+7
The ultimate tool for Price Action and ICT. High, Low and Mid levels for days, weeks Inc. NY Midnight and Custom Range.
Indicateur
Key Levels
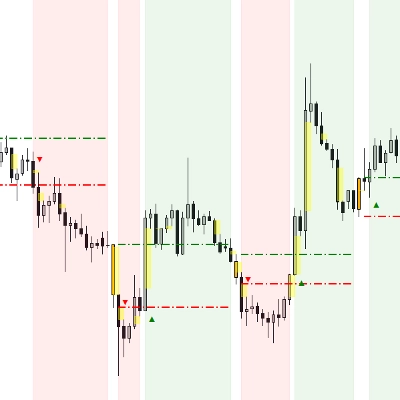
Spots key hourly ranges and signals breakouts using arrows & colored background zones. Ideal for Gold.
Indicateur
VWAP
Volume
+5
Multi VWAP. Three timeframes. One clean chart. Your Essential Trading Tool.
Indicateur
Key Levels
Trend-filtered signals, transparent trade plans and a multi-timeframe decision panel for cTrader.
Indicateur
ATR
SMC
+15
Plot ATR-based SL and 1R/2R/3R TPs instantly for any trade, with clear R-multiple risk mapping.
Indicateur
Prop
Forex
+4
Pivot Points Standard — All-in-One Multi-Timeframe Pivot Indicator for cTrader
Indicateur
Parabolic SAR Alert - Trend reversal alerts with smart signals & custom alerts.
Indicateur
Forex
BTCUSD
+11
📈 Adaptive ALMA-Gaussian hybrid trend filter with precision smoothing and clear buy/sell signals.
Indicateur
CandleColourFlow MultiFx - optimized to work on Fx Majors, Fx MInors, Fx Crosses
Indicateur
Forex
Real-Time Candlestick Pattern Detection with Custom Alerts & Trend Analysis for cTrader
Indicateur
SMC
Forex
+5
ICT liquidity engine for Gold: maps stop clusters, scores zones & projects the next target. Now with 4 ICT killzones.
Indicateur
ATR
RSI
+9
🚀 MACARX Indicator - The Multi-Indicator Trend Fusion 🚀
Indicateur
RSI
MACD
This indicator is a combination of MACD and RSI into one. This is perfect fusion and powerful indicator ever.
Indicateur
Drawdown Monitor
Protect your funded account. Real-time Daily Equity Drawdown monitor with Green / Orange / Red flashing alerts.
Indicateur
Prop
Forex
+11
🧭 See when your market tends to move—by Month, Day-of-Week, or Hour-of-Day🧭

Prix

Depuis le 22/09/2024
15
Ventes
3.88K
Installations gratuites